Yes, simply log in, click on your company name and select the "+" symbol.

Empower your organisation streamline reporting, enhance decision-making, and drive growth.
Roveel allows you to dive deep into your Xero & Sage data with drill-down analysis at the transaction level, uncovering insights beyond surface-level numbers.
Roveel automates the reporting process, saving you hundreds of hours from manually editing spreadsheets and providing instant access to actionable business insights from your Xero data.
Getting started with Roveel's Xero & Sage integration is quick and easy, allowing you to connect and start analysing your data in minutes.
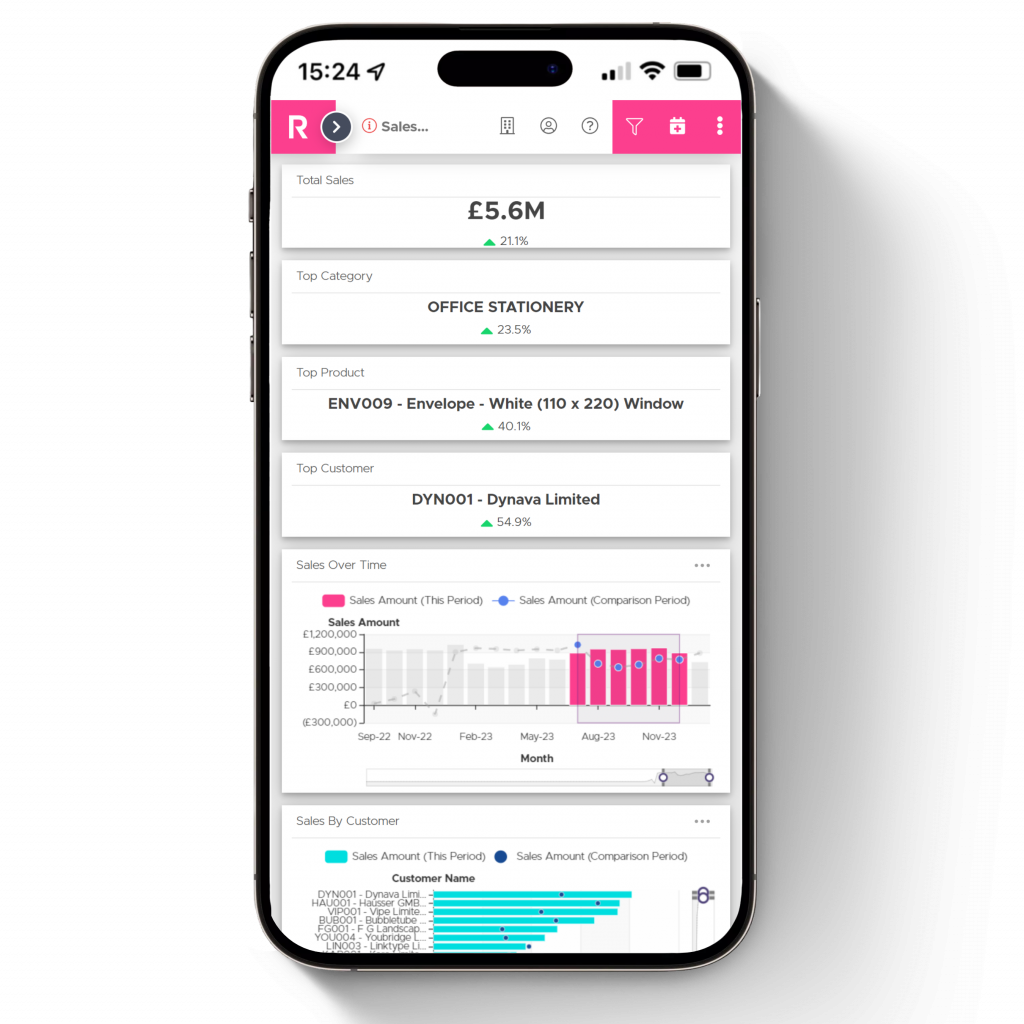
Roveel offers affordable monthly pricing plans that provide easy access to powerful dashboards and reports from your desktop, tablet, or mobile devices.
With Roveel, you can enjoy the flexibility of unlimited users, each with customisable access to the reports they need from your data.
Roveel prioritises data security by utilising robust security protocols, two-factor authentication, and storing data securely in AWS infrastructure, giving you peace of mind.
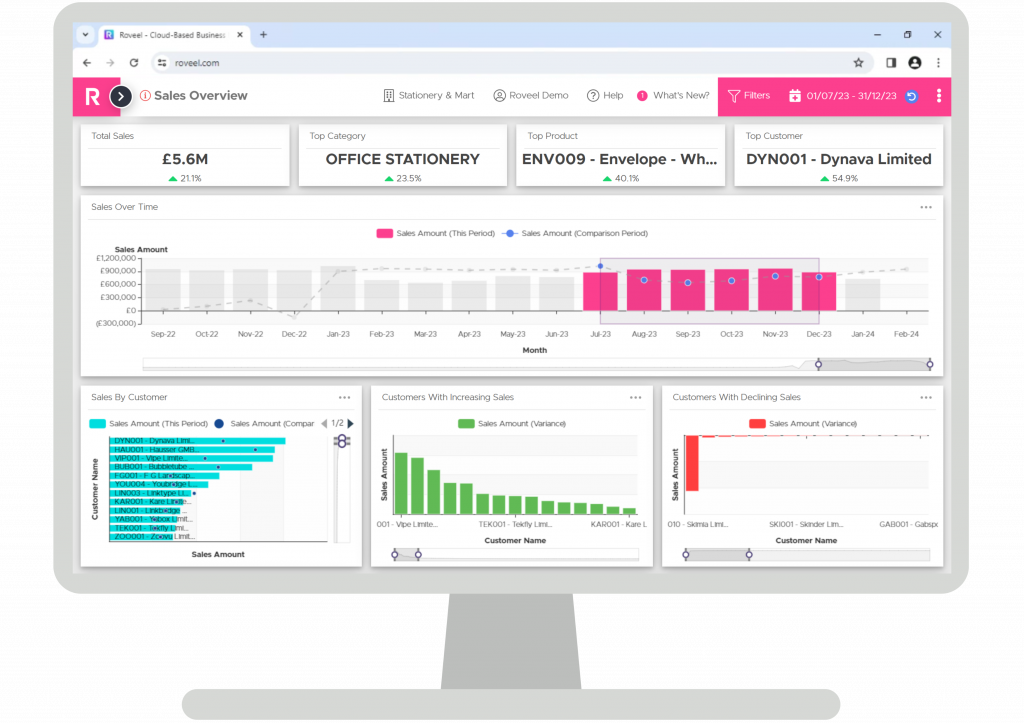
Supercharge your sales performance with Roveel.
Monitor your sales targets in real-time with the Sales Targets dashboard.
Leverage the Customer Analysis dashboard to identify top clients and spot upselling opportunities.
Use the Product Analysis dashboard to focus on your best-selling items.
Improve your conversion rates with the Quotations Summary feature.
Visualise profit margins on invoices with the Invoice Profit Overview report.
Empower your team with data-driven decisions and watch your sales soar!

Streamline your financial management with Roveel.
Compare actual vs. budgeted figures with the Budget vs. Actual Profit & Loss dashboard.
Visualise your cash flow journey with the Cash Bridge and Cash Flow Monthly tools.
Dive deep into transactions with the Transaction Analysis feature.
Examine five-year financial performance with the Last 5 Years Profit & Loss dashboard.
Apply the 80/20 principle to your finances with the Pareto Analysis dashboard.
Take control of your company’s financial health and drive informed decision-making.

Optimise your business operations with powerful analytics.
Get a high-level view of all projects with the Project Overview dashboard.
Identify slow-moving stock and manage inventory effectively with the Slow Moving Stock report.
Keep track of your inventory value in real-time with the Stock Valuation dashboard.
Analyse profitability by department with the Departmental Profit & Loss feature.
Monitor sales order fulfilment with the Sales Orders dashboard.
Streamline your operations and boost efficiency across your organisation.

Get a holistic view of your business performance and gain strategic insights.
Visualise your company's financial health with the Visual Profit & Loss dashboard.
Monitor key metrics across sales, finance, and operations in one place.
Analyse the financial performance of your projects with the Project Profitability tool.
Examine five-year trends with the Last 5 Years Profit & Loss dashboard.
Visualise profit margins on invoices with the Invoice Profit Overview.
Empower your leadership with real-time data and insights for confident decision-making.

Empower your sales team with actionable insights:
Real-time sales performance dashboards
Customer segmentation analysis
Sales pipeline visualization
Revenue forecasting tools
Product performance metrics
Benefit: Make data-driven decisions to boost sales and identify growth opportunities.
Streamline your whole organisation with greater visibility and insight over every purchase you make. Better understand your relationships with your suppliers and get the upper hand on negotiations.
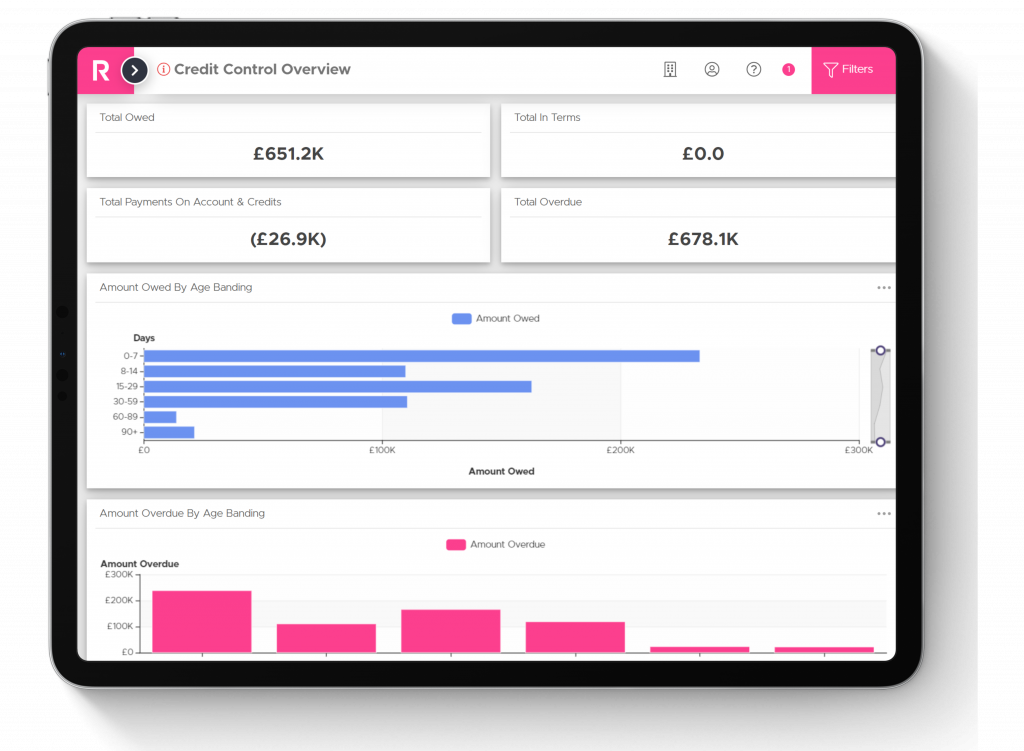
Improve your cash flow by easily targeting your problem payers and arming your team with all the information they need for those tricky conversations.

William Morton, Finance Director
Saxon Air
Jim Copeland, Managing Director
Tempcon

Yes, simply log in, click on your company name and select the "+" symbol.
We offer a full design, build and deploy process, personal to your business. Email your requirements to us at [email protected]
Roveel automatically synchronises your file when you first get set up and auto refreshes on a daily basis without the need to export or import any files manually.
Roveel is a responsive web application which can be accessed on your desktop, laptop, mobile or tablet. The web address can be bookmarked into your favourites and a shortcut created as an “app” on your mobile / tablet device. See our help article here.


Discover the impact Roveel can have on your business. Get your free 14-day trial today.

Vibrant, insightful & drill-down cloud based dashboards for Sage and Xero. Improved decision making in an instant.


To provide the best experiences, we use technologies like cookies to store and/or access device information. Not consenting or withdrawing consent, may adversely affect certain features and functions.