Monitoring and understanding your overheads, budgets, occupancy rates and income streams is vital to the success of being a care home provider
Start a free trial today with out-of-the-box business dashboards to get connected with your data.

4.67 Stars (59 Reviews) 2024
Source: Delighted.com

The Top 5 Roveel dashboards used by Health and Care Home providers
- 1
Overheads Analysis
Monitor the components of your overheads and understand trends and anomalies. - 2
Nominal Sales Overview
Split revenue streams graphically by nominal code and category. Quickly identify opportunities for change. - 3
Profit & Loss
Drill into your P&L to the underlying transactions, split by department and quickly compare across any date range. - 4
Budget P&L
Monitor and track your performance against budget. Either upload your budget direct into your accounting software or upload into Roveel for in-depth analysis. - 5
Cash Summary
Monitor and track your cash position on a daily basis, providing a detailed breakdown and grouping by bank account.
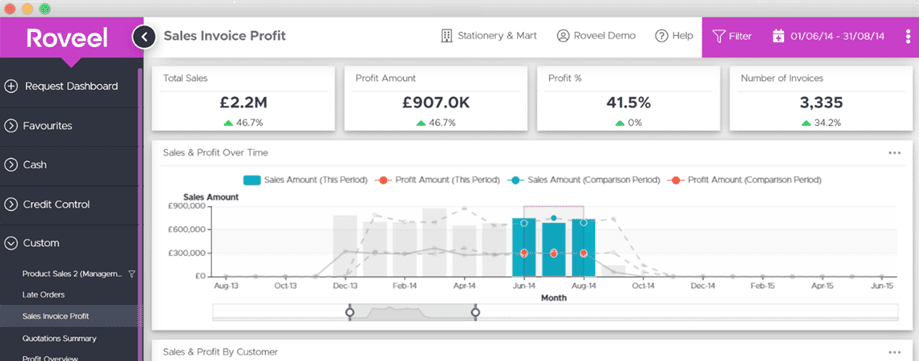
Closely monitor your profitability
With instant visibility of your data from anywhere, you can monitor your KPI’s, such as revenue per day, revenue per mile or even your fuel costs and quantities per mile.
Understand your sales and profitability by driver, customer, region, type of customer and more
Use the power of your data to quickly and easily identify the granular aspects of your business performance. Using Roveel to quickly access the information you require prevents you from running your business blind.
Replace your spreadsheets
Remove the time you spend on creating and collating your data. Spend your time evaluating and responding to your data
Monitor Cash & debtors
Use our out of the box dashboards to analyse your debtors and monitor your cash position on a daily basis.