We are delighted to publish our latest set of release notes, which outlines the new Roveel dashboards and features available to all users.
CFOs, Financial Controllers, and Accountants have been a core focus this month. We have released new Rolling P&L and Cash Bridge dashboards and made significant changes to the layouts and functions of our current Finance dashboards. We now offer customised finance dashboards, including Profit and Loss and Balance Sheet dashboards bespoke to your requirements, allowing you to access your numbers more efficiently than ever before. Collectively, these enhancements represent a substantial improvement to Roveel’s capabilities.
As part of our commitment to the platform, we have also enhanced a number of our existing dashboards and reports. You can find a list of these modifications at the foot of these release notes.
New Free Default Dashboard:
Finance: Rolling Last 12 Months P&L
New Marketplace Dashboard:
Finance: Cash Bridge – £7.50 (€8.85) per month
Custom Dashboards:
Table Enhancements for Custom Dashboards (Customised Profit and Loss Dashboard Capabilities)
Dashboard Enhancements & Minor Tweaks:
Balance Sheet & P&L Dashboards Including Monthly and Budget V Actual
Budget V Actual Only
Overheads Summary and Cost of Sales Summary
Quotations Summary
Sales Orders Summary
Sales Overview, Sales Quantity and Service Sales Overview
Trade Creditors & Credit Control
New Free Default Dashboard
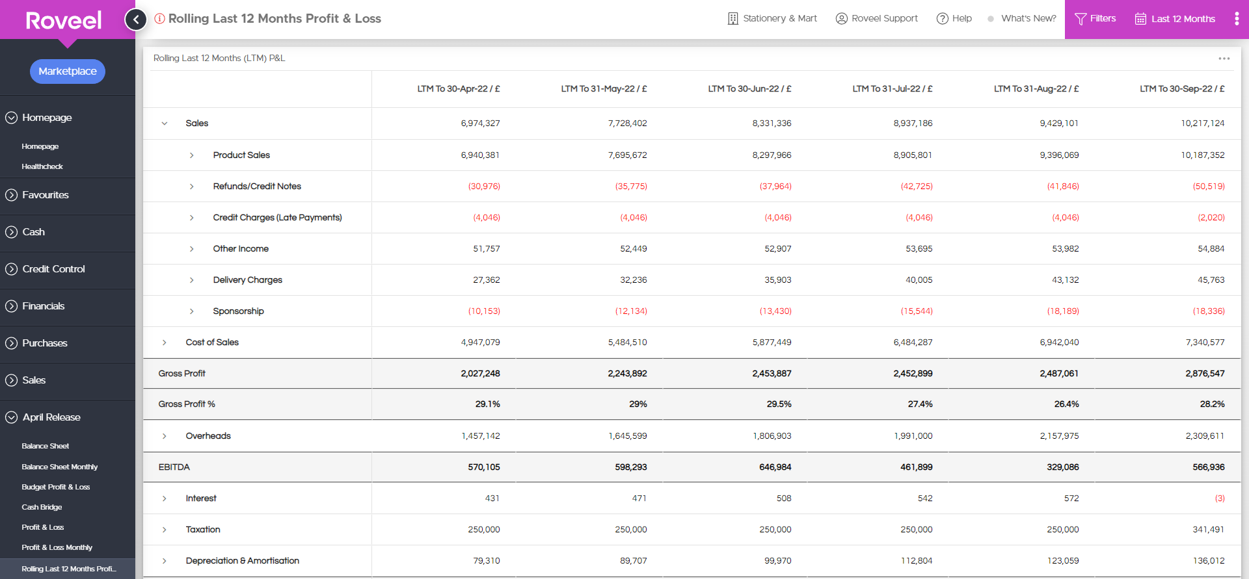
Rolling Last 12 Months (LTM) Profit & Loss
Our new Rolling 12 Months Profit and Loss dashboard is a financial statement that tracks the performance of the business growth over the last 12 months.
The Rolling Last 12 Months Profit and Loss is a valuable dashboard that can assist your business in identifying trends in their financial performance over time and evaluating the monthly performance of the business.
Ideal For: MD’s, Accountants, CFOs, Finance Directors and Finance Controllers
New Marketplace Dashboard
Cash Bridge – £10.00 per month
View Cash Bridge Marketplace Listing
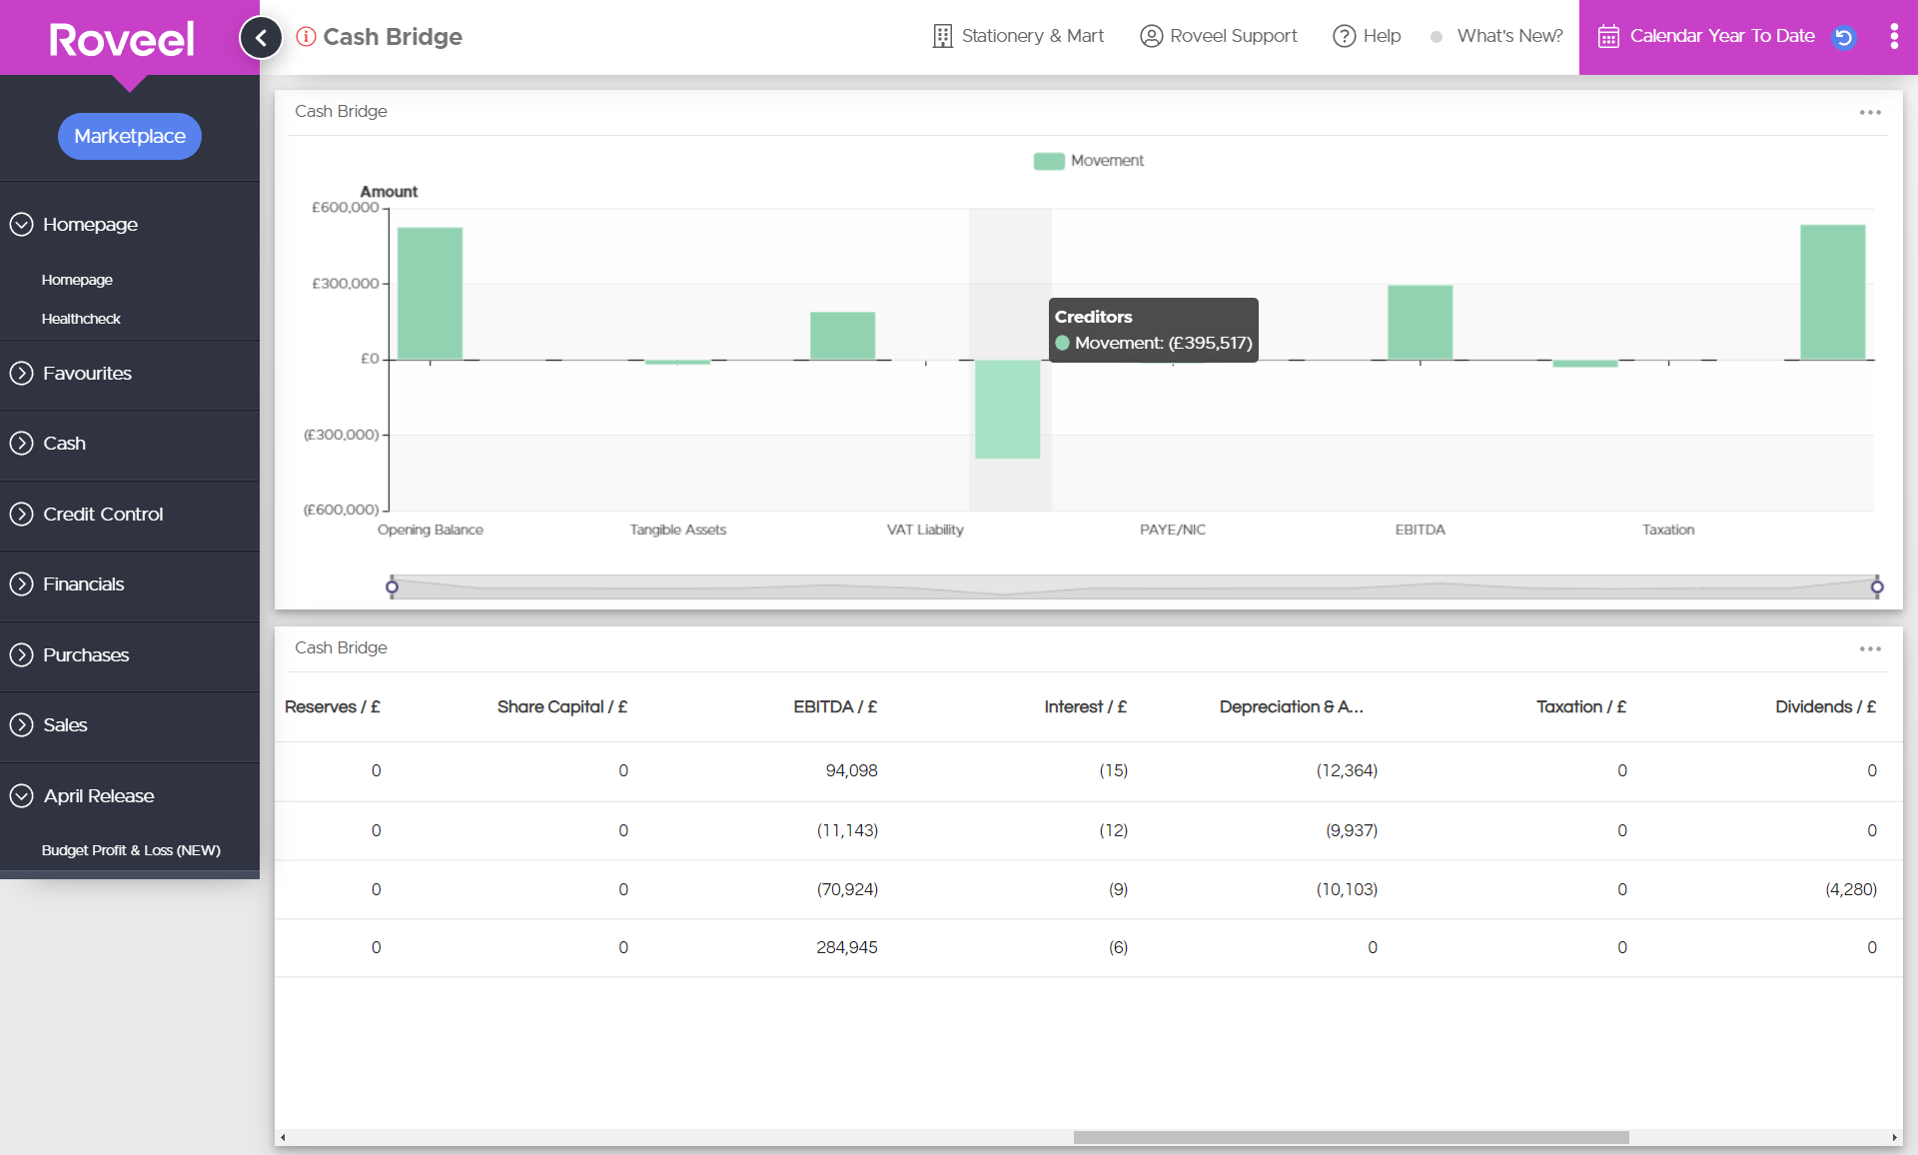 Our new cash bridge dashboard summarises the movement in cash balances and identifies how this has been generated or spent. Have you reduced your cash position due to paying suppliers more quickly? Have you converted your profit into cash? Have you reduced your stock value and therefore increased your cash?
The Cash Bridge is a valuable financial dashboard that assists your businesses in identifying and analysing the movements in cash balances between two time periods. This can assist you in identifying cash flow issues, such as unanticipated expenses or changes in revenue that may have contributed to a decrease in your cash balance, and also opportunities to improve cash flow, such as optimising your payment and collection processes.
Ideal For: Accountants, CFOs, Finance Directors and Finance Controllers
Custom Dashboards
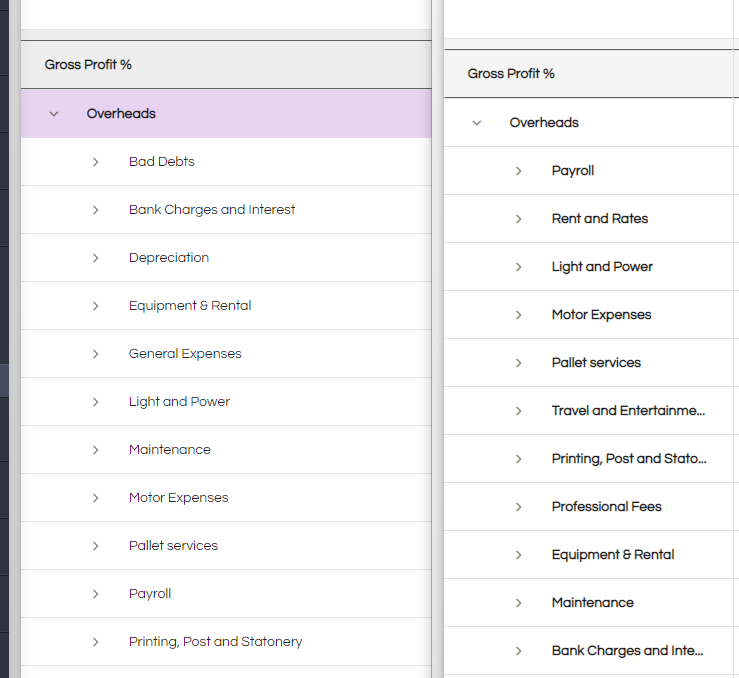
New Table Enhancements (Customised Profit and Loss Dashboard Capabilities)
View Customised Profit and Loss Marketplace Listing
 In addition to launching two new financial dashboards, we have made significant behind-the-scenes enhancements to the tables in Roveel. This has granted us new capabilities to modify rows, add new colours, and change the dashboards’ general formatting. We can now offer fully tailored finance dashboards, such as customised Profit and Loss dashboards, based on your individual preferences.
Please contact our team to arrange an initial meeting.
We can customise:
Colours,
Row and column layouts,
Ordering of codes and categories,
Inclusion or exclusion of data,
Dashboard Enhancements & Minor Tweaks
Balance Sheet and Profit & Loss Dashboards Including Monthly and Budget V. Actual:
Expand to Level One & Two Options: We’ve added two new options to our finance dashboards that allow users to expand to two distinct levels. Instead of enlarging straight to the nominal code level (Level Two), we’ve added an intermediate option that expands the table only to the categories (Level One).
Column Filter Options: The column headings of each of the financial dashboards are editable and customisable by users. Users can now edit the headings and modify the size of each bar by hovering next to the edges of each column on the upper bar. (Insert image of menu options and show have to click the three lines)
Export to CSV Enhancements: We upgraded the standard CSV and Excel export templates for each of these dashboards. Users will have a cleaner-looking Excel document that can be incorporated into a report.
Financial Category Ordering: We have also adjusted the default ordering of the nominal categories in the Profit and Loss and Balance Sheet dashboards. Now, categories will be ordered as set up in the default chart of accounts in the data set rather than alphabetically.
Budget V Actual:
Column Heading Enhancement: We have modified the column headings so that the date ranges depicted between the budget and actual figures are more apparent in the headings of the column.
Overheads Summary and Cost of Sales Summary:
Inclusion of Transaction Tables: The Overheads and Cost of Sales Summary dashboards have been updated to include a transactions table. This table displays all transactions within your Profit and Loss that are allocated to overheads or cost of sales. When a specific date range, category, or nominal is selected, Roveel will automatically display all transactions that are included in the selection.
Quotations Summary:
Inclusion of Order Number on the Quotations Table: Within our Quotations table, we have added a new column containing the Order Number.
Sales Orders Summary:
Addition of Customer Drill Down Functionality: Users will now be able to access a customer’s specific sales or information dashboards by right-clicking on that customer in the Sales Orders Summary Dashboard.
Addition of Total Sales Orders to Highlights: The Total Quantity and Value of Sales Orders figures have been added to the highlights at the top of the dashboard.
Sales Overview, Sales Quantity and Service Sales Overview:
Dashboard Highlights Filter Effect: The Sales Dashboards’ Product Category, Product, and Customer highlights will now be updated when a filter is applied.
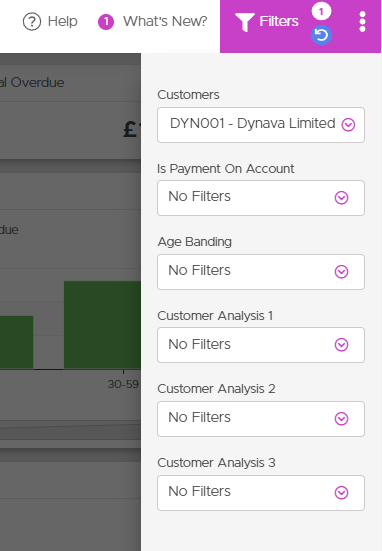
Trade Creditors & Credit Control:
Payment on Accounts Filter Option: In the Trade Creditors and Credit Control Dashboards’ filter bar, the ability to exclude account payments from the dashboard has been added.