We are pleased to share our first 2023 release notes, which details the new Roveel dashboards and features available to you.
We are dedicated to enhancing Roveel, and we will keep all users informed about all new releases.
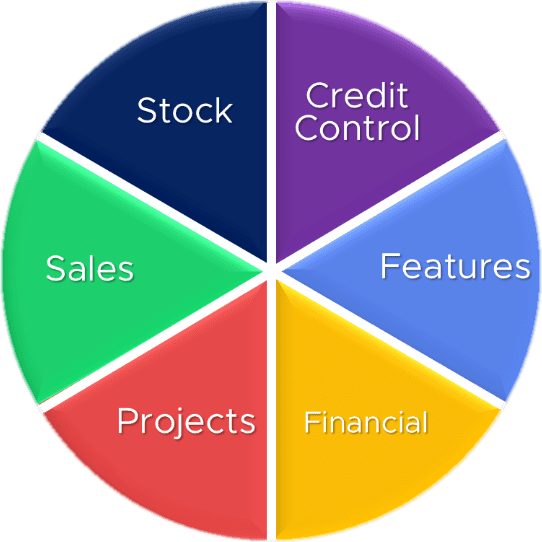
In February, we are releasing five new default dashboards to all admin users and nine additional dashboards to our Roveel Marketplace in key business areas.
In addition to these dashboards, we have enhanced a number of our existing dashboards and system upgrades to deliver performance enhancements. Read our quick summary below and in-depth review of these amazing new dashboards available to you today.
Summary
Five New Default Dashboards
Homepage
Healthcheck
Service Sales Overview
Trade Creditors
Trial Balance
Nine New Marketplace Dashboards
Sales: Quotations Summary, Product Analysis, Customer Analysis, Nominal Sales Summary & Sales Targets.
Stock: Slow Moving Stock, Stock Valuation.
Finance: Visual Budget Profit & Loss, Visual Profit & Loss.
Enhancements & Minor Tweaks
System: Performance improvements – enhancing loading times of your dashboards.
Dashboards with minor tweaks: Sales Overview, Supplier Information, Product Information, Customer Information, Customer Sales & Credit Control Overview.
Five New Default Dashboards
We are launching five new default dashboards as part of your existing subscription.
Admin users will need to assign new default dashboards to all non-admin users who require access. Follow the steps in the following article to achieve this: Roveel FAQs
Homepage
The new Homepage will serve as the company hub, provide you with an overview of your organisation through a variety of insights from main business categories.
Example insights: weekly sales, orders, customers, debtors & creditors all in one place!
Ideal for: Directors, Shareholders, CEOs, Finance Directors.
Healthcheck
The new Healthcheck dashboard will give users reassurance of the quality of the data that Roveel is visualising, assuring the integrity of the dashboards.
Example insights: last backup, transaction, invoices and sales orders date, transaction number and additional details including bank accounts reconciliation date and balance.
Ideal for: Auditors, Finance Controllers, Accountants, Finance Directors and bookkeepers.
Service Sales Overview
Visualise your sales nominal codes and nominal categories’ performance and compare it to their prior performance to identify potential sales opportunities with your customers.
Example insights: sales by customer, nominal code, nominal code category & department.
Ideal for: Managing Directors, CEOs, Sales Directors & Finance Directors.

Trade Creditors
Our new Trade Creditors dashboard will offer you knowledge of your creditors and duties related to overdue payments to your suppliers allowing you to monitor your liabilities.
Example Insights: detail by supplier, amount owed and overdue by age banding.
Ideal for: Financial Controllers, Supplier Managers, Finance Directors, CEOs.
Trial Balance
Examine your books and set of accounts as part of your accounting procedures. Check that the entries in your company’s accounting system are mathematically perfect!
Example Insights: nominal codes, debit, credit and net value including transactions.
Ideal for: Auditors, Finance Controllers, Accountants, Finance Directors and bookkeepers.
Nine New Marketplace Dashboards
Our Roveel marketplace now has nine new dashboards for Finance, Sales, and our new focus segment, Stock.
Finance
Visual Budget Profit & Loss
Compare budget to actual visually to track your performance with respect to your budgets. You can assess visually if you are on track, falling short, or surpassing your budgets and goals by using Roveel’s Visual Budget Profit & Loss dashboard.
Example insights: sales, cost of sales, gross profit and %, overheads and ebitda actuals against budget.
Ideal for: Directors, Shareholders, CEOs, Finance Directors.
Visual Profit & Loss
Compare your nominal codes and their relevant categories to prior performances by visualising your chart of accounts.
Example insights: spend by sales, costs of sales and overheads nominal code and nominal code category.
Ideal for: Directors, Shareholders, CEOs and Finance Directors.
Sales
Product Analysis and Customer Analysis
Compare and contrast the manually categorised Sage customer and product analysis fields. In Sage, analysis codes provide an extra method for categorising customers and products. Please see our page on analysis fields for additional information: Roveel FAQs
Example insights: sales by customer, product and nominal analysis.
Ideal for: CEOs, Sales Directors & Sales Reps.
Nominal Sales Summary
Separate your nominal sales 4000 codes into bar charts to visualise your sales performance across your income streams. Please be aware you will need to liaise with the Roveel team for us to manually configure each chart with the matching nominal code name for this dashboard.
Example insights: nominal sales by 4000 codes.
Ideal for: CEOs, Sales Directors & Finance Directors.
Quotations Summary
Compile a summary of your company’s performance in obtaining new quotations and the frequency of quotes that are won, lost or cancelled.
Example insights: quotations over time, won & lost value and volume, quotations taken by & by customer.
Ideal for: CEOs, Sales Directors & Finance Directors.
Sales Targets
Compare your actual sales against your sales targets. Sales targets can be imported manually without the use of Sage 50, The Roveel team will require your sales target data manually imported into an excel sheet.
Example insights: sales & targets over time and by customer, with analysis of other customers ahead and behind target.
Ideal for: CEOs, Sales Directors, and Finance Directors.
Stock
Slow Moving Stock
Determine which stock items are moving slowly, helping to give an idea of the goods that may need promotion to sell to avoid becoming an issue in your warehouse and locking up your cash in stock.
Example insights: active / inactive stock category over last 3, 6 and 9 months.
Ideal for: CEOs, Sales Directors, Finance Directors and Stock Controllers.
Stock Valuation
Display the current and historic value and quantity of your business’ warehouse inventory / stocks. Quickly identify areas for improvement.
Example insights: total stock, allocated, free and on order quantity and value.
Ideal for: CEOs, Sales Directors, Finance Directors and Stock Controllers.
Enhancements & Fixes
Performance: During the last year, the Roveel team has worked hard to improve the system’s performance, including adjusting and upgrading a variety of our existing dashboards whilst maintaining the look and feel that you already know and trust. The platform’s speed has been enhanced across all dashboards. Here is a comprehensive list of the changes we’ve made to Roveel.
Dashboard Updates
Credit Control
Now shows “Gross Sales” in highlight and sales over time.
Customer, Product & Supplier Information
Analysis fields now have the label attributed to them which is stored in Sage.
Customer Sales
Customer Sales now displays open sales value.
Product Info
New chart for Bill of Materials added.
Sales Overview
Addition to filter options to include transaction type e.g., SI (sales invoice), SC (sales credit).
Restriction applied so only sales information posted to 4000 nominal code ranges are accounted for.
Supplier Summary
Number of Suppliers has been amended to be number of active suppliers in the date range.