We are bringing you the latest updates, news and features from Roveel.
 New Free Dashboards (included as part of your subscription):
Cash Flow Statement
Rolling Last 12 Months (LTM) Customer Sales
New Marketplace Dashboards
Monthly Cash Flow Statement
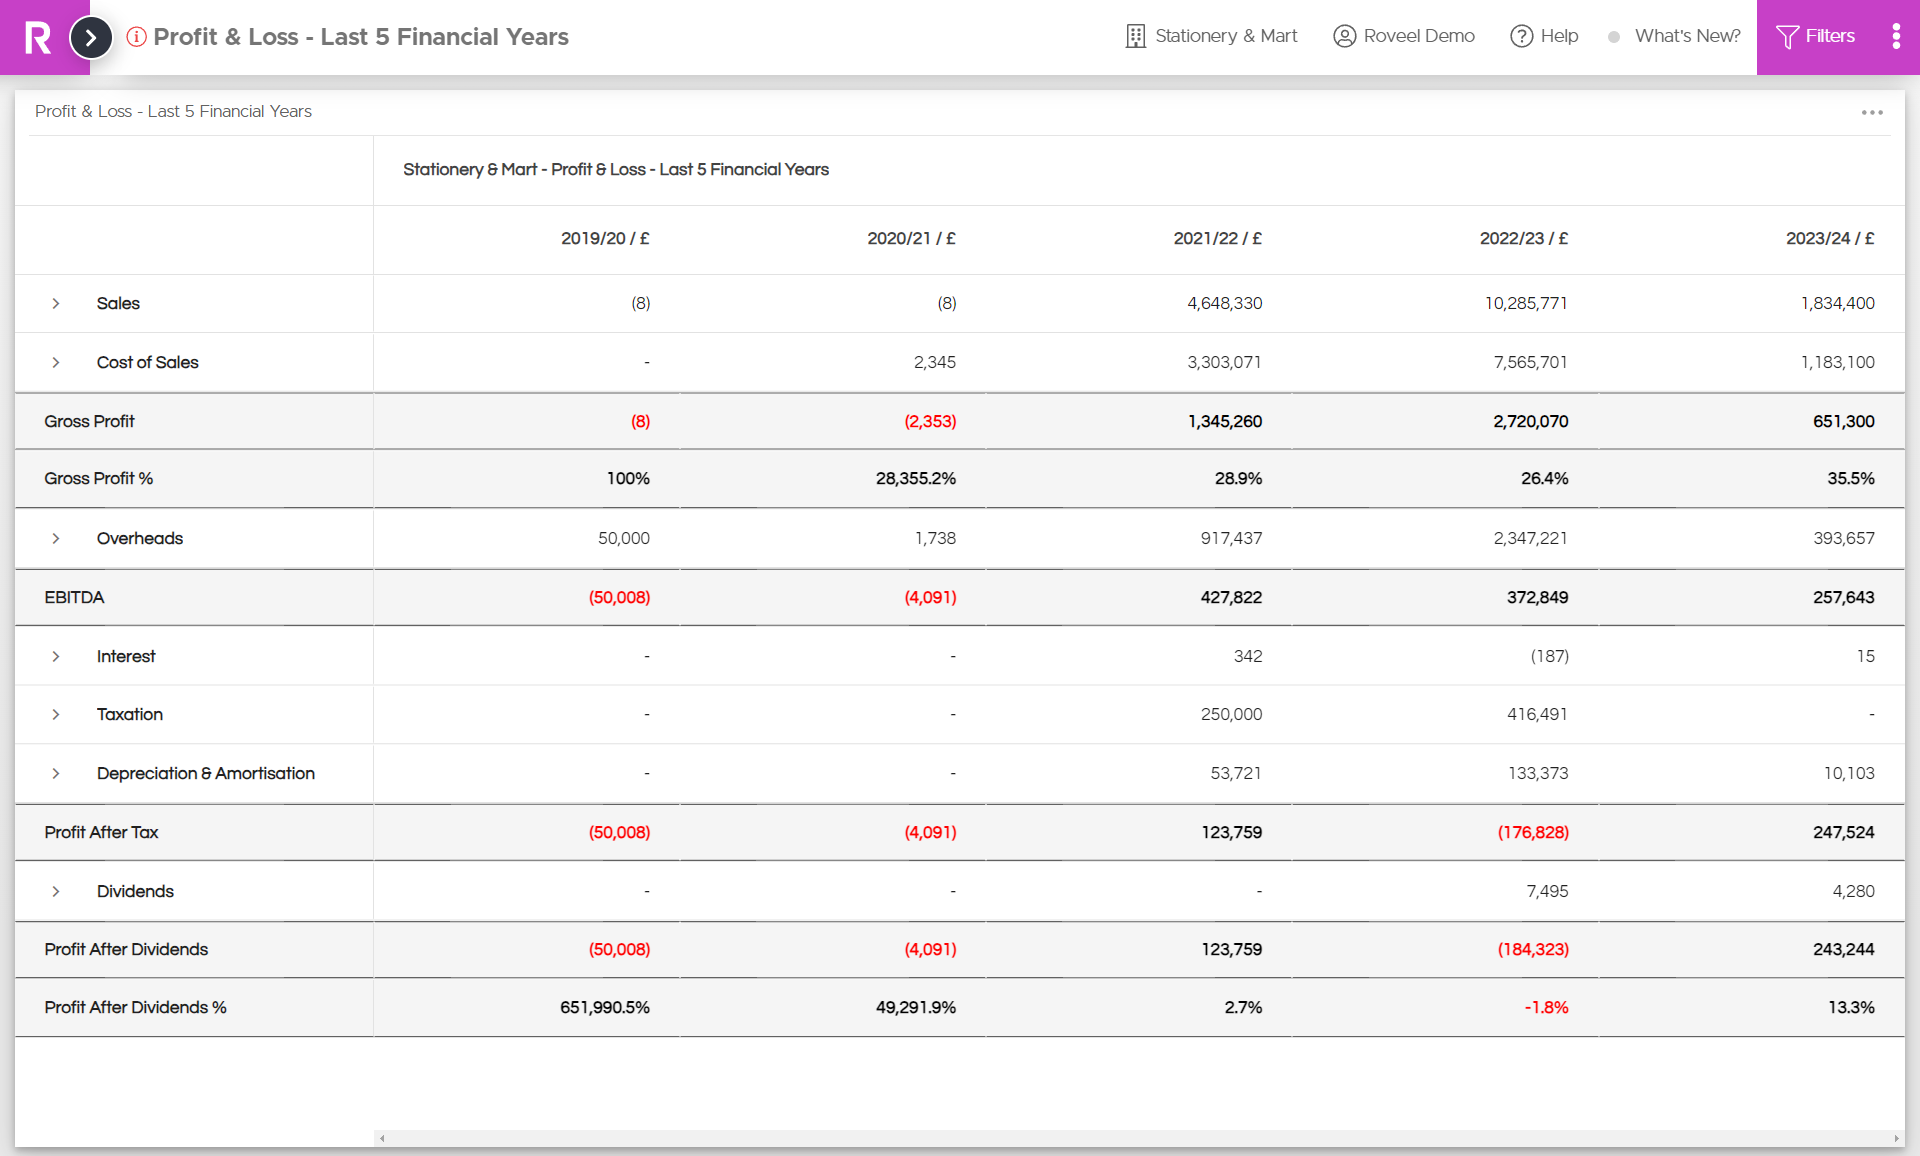
Profit & Loss – Last Five Financial Years
Rolling Last 12 Months (LTM) Product Sales
Rolling Last 12 Months (LTM) Product Quantity
Ecommerce Dashboard
Dashboard Enhancements & Minor Tweaks:
Customer Analysis Fields 1-6 Filters
Supplier Analysis Fields 1-6 Filters
Project Dashboards
Quotations Summary
Sales Order Summary
Sales Overview
New Dashboards (included as part of your subscription)
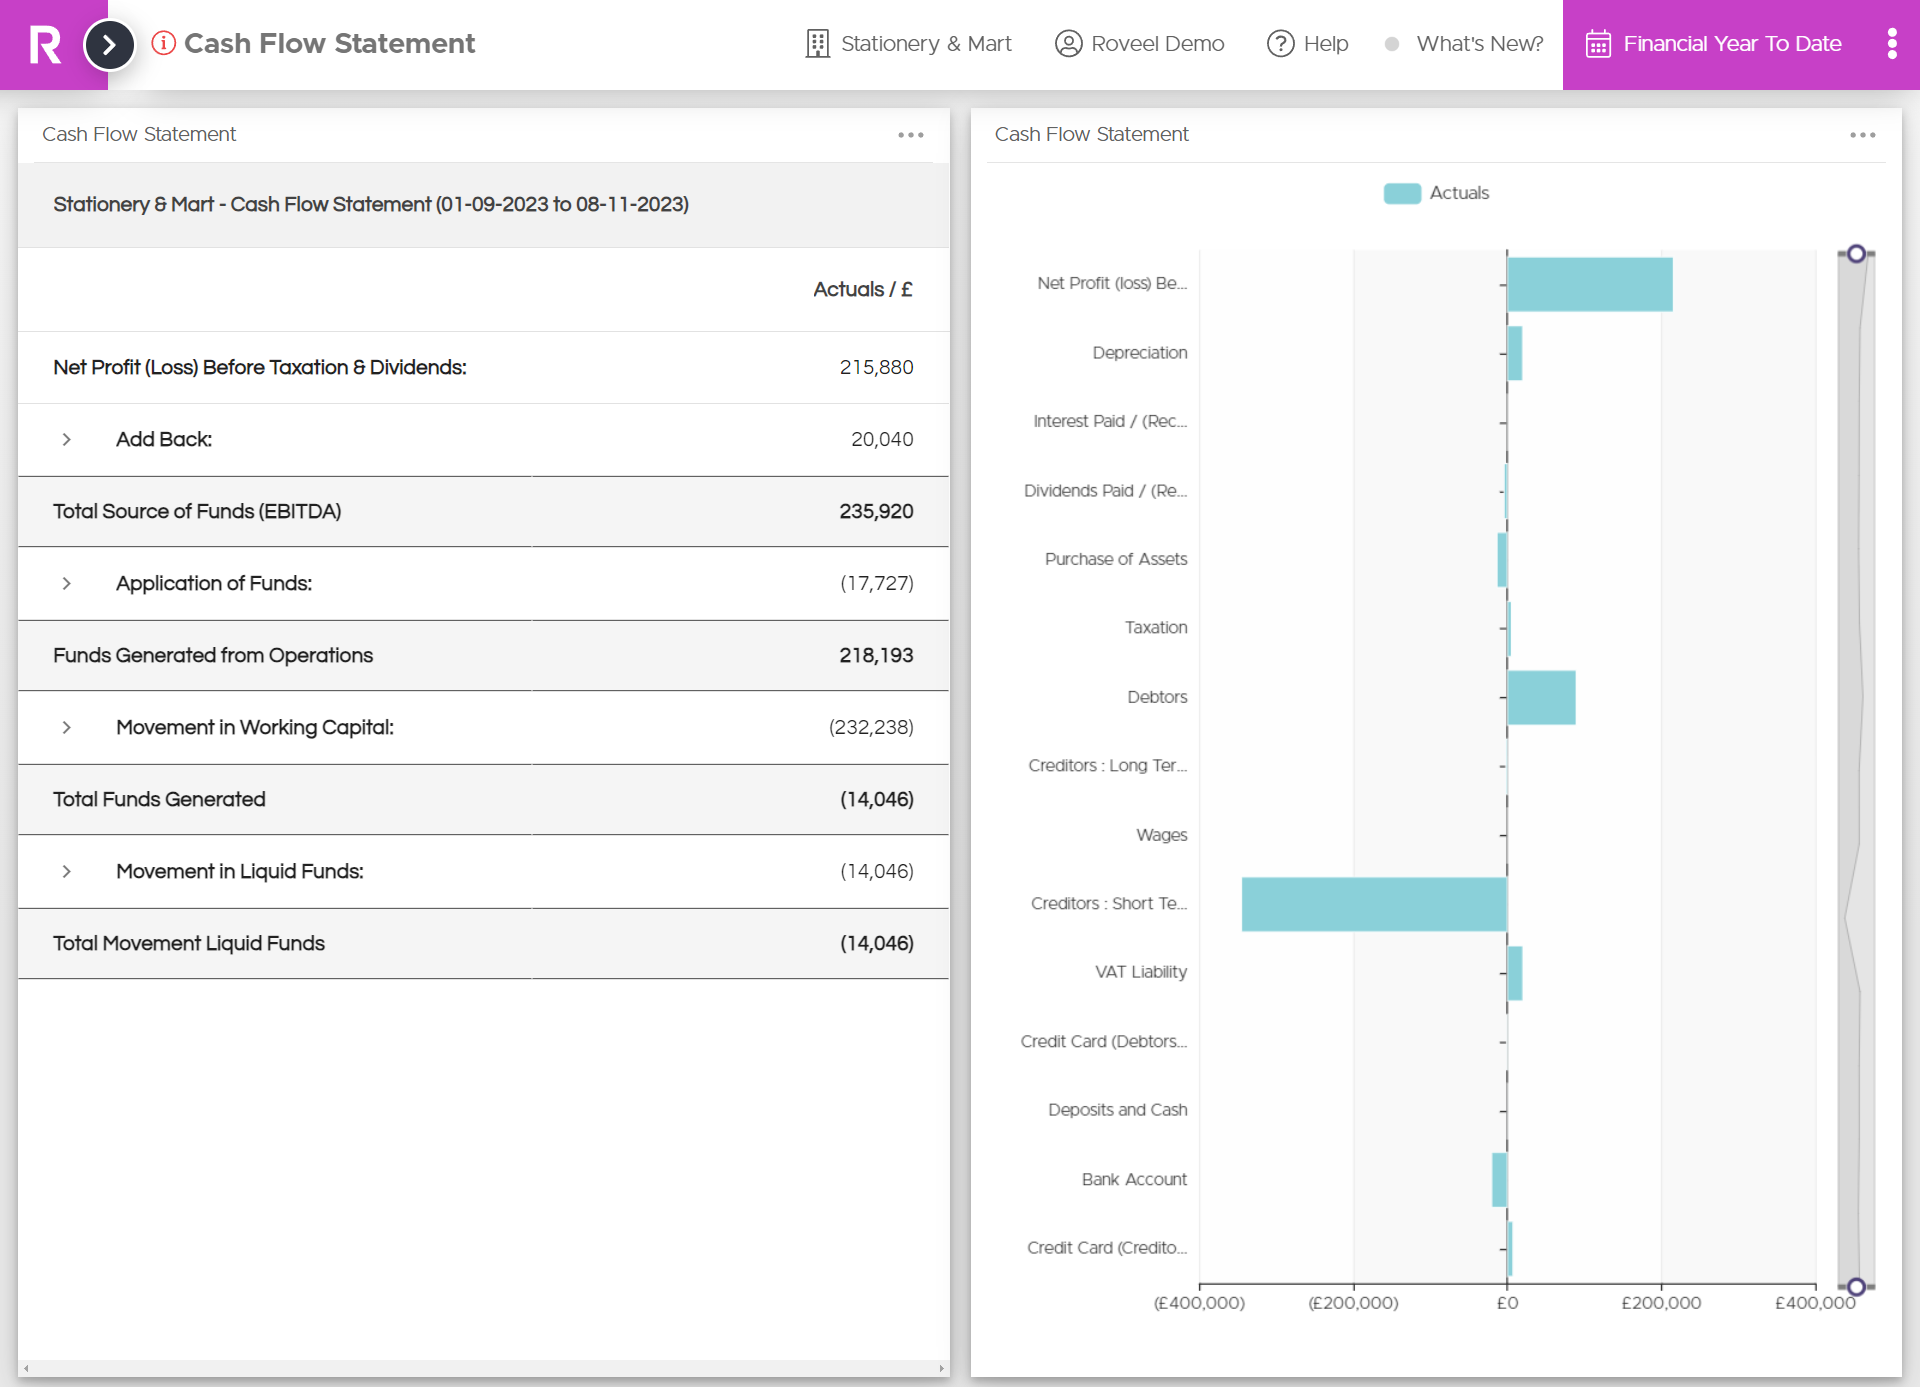
Cash Flow Statement
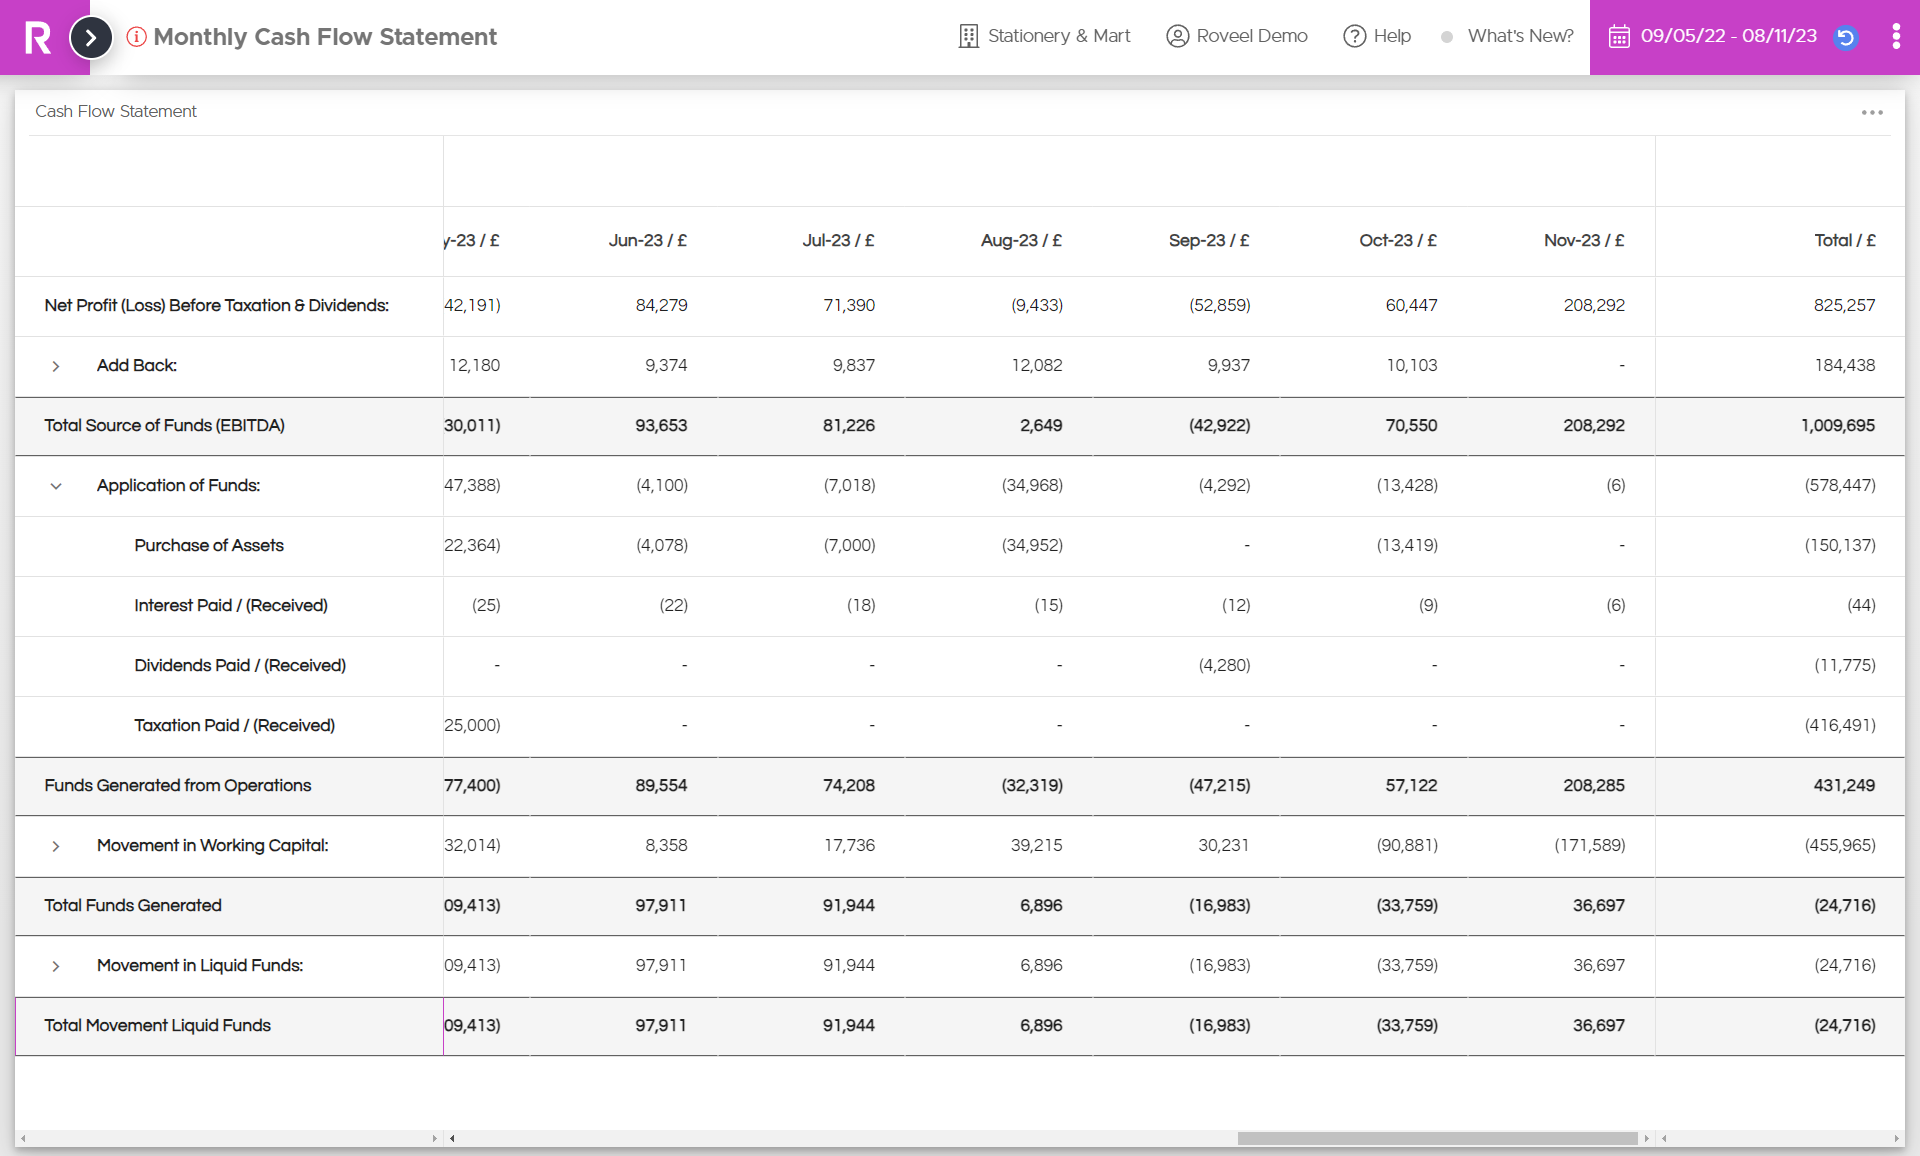
Cash is king in all businesses, which is why it is important to paint a picture of exactly where it is being generated from and where it is leaking out of your business.
Our new Cash Flow Statement is an essential financial statement completing Roveel’s suite of financial dashboards.
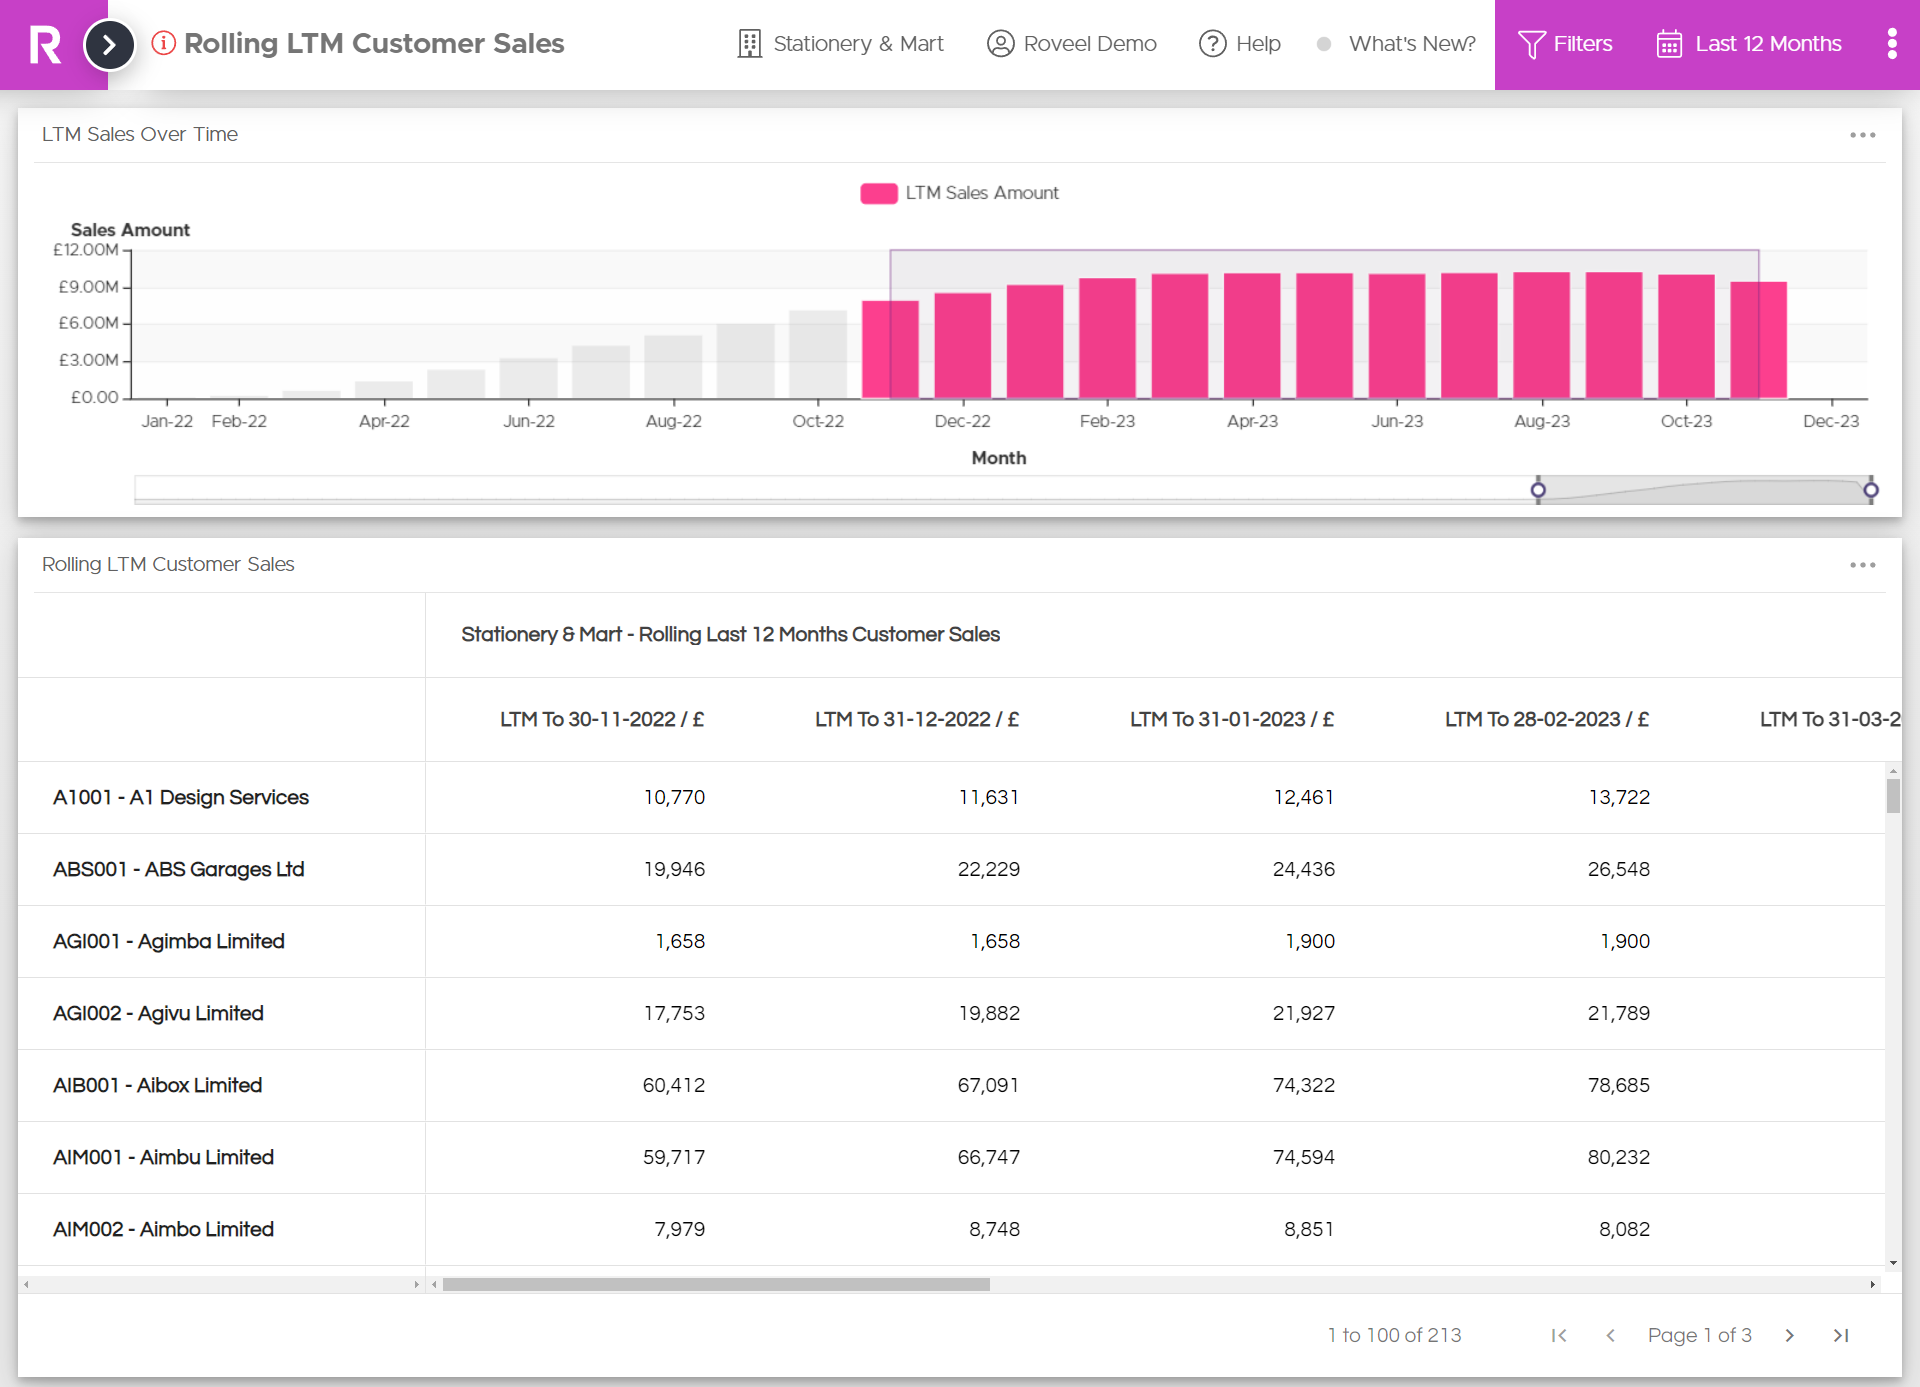
Rolling Last 12 Months (LTM) Customer Sales
Gain an overview of your customer’s sales over a full year. Identify the trends of your customer sales, enabling you to instantly detect which month a customer’s sales start to decline and use the data from Roveel to identify opportunities early.
Are you unable to access our new dashboards? Please refer to the following article: https://roveel.zendesk.com/hc/en-gb/articles/9091880498973-Assigning-New-Dashboards-To-Users
New Marketplace Dashboards
Monthly Cash Flow Statement
Analyse your Cash Flow Statement on a monthly basis. Pinpoint which months are leaking cash and when strong business performance is replenishing those reserves.
View Monthly Cash Flow Statement
View Profit & Loss – Last Five Financial Years
Rolling Last 12 Months (LTM) Product Sales & Product Quantity
Expanding on our new Rolling Last 12 Months (LTM) Customer Sales Dashboard, we have added two LTM dashboards analysing product quantities and sales value to our Marketplace. Now you can identify the trends of your product sales by both value and volume to identify sales opportunities.
View Rolling Last 12 Months (LTM) Product Quantity View Rolling Last 12 Months (LTM) Product Sales

E-commerce Dashboard
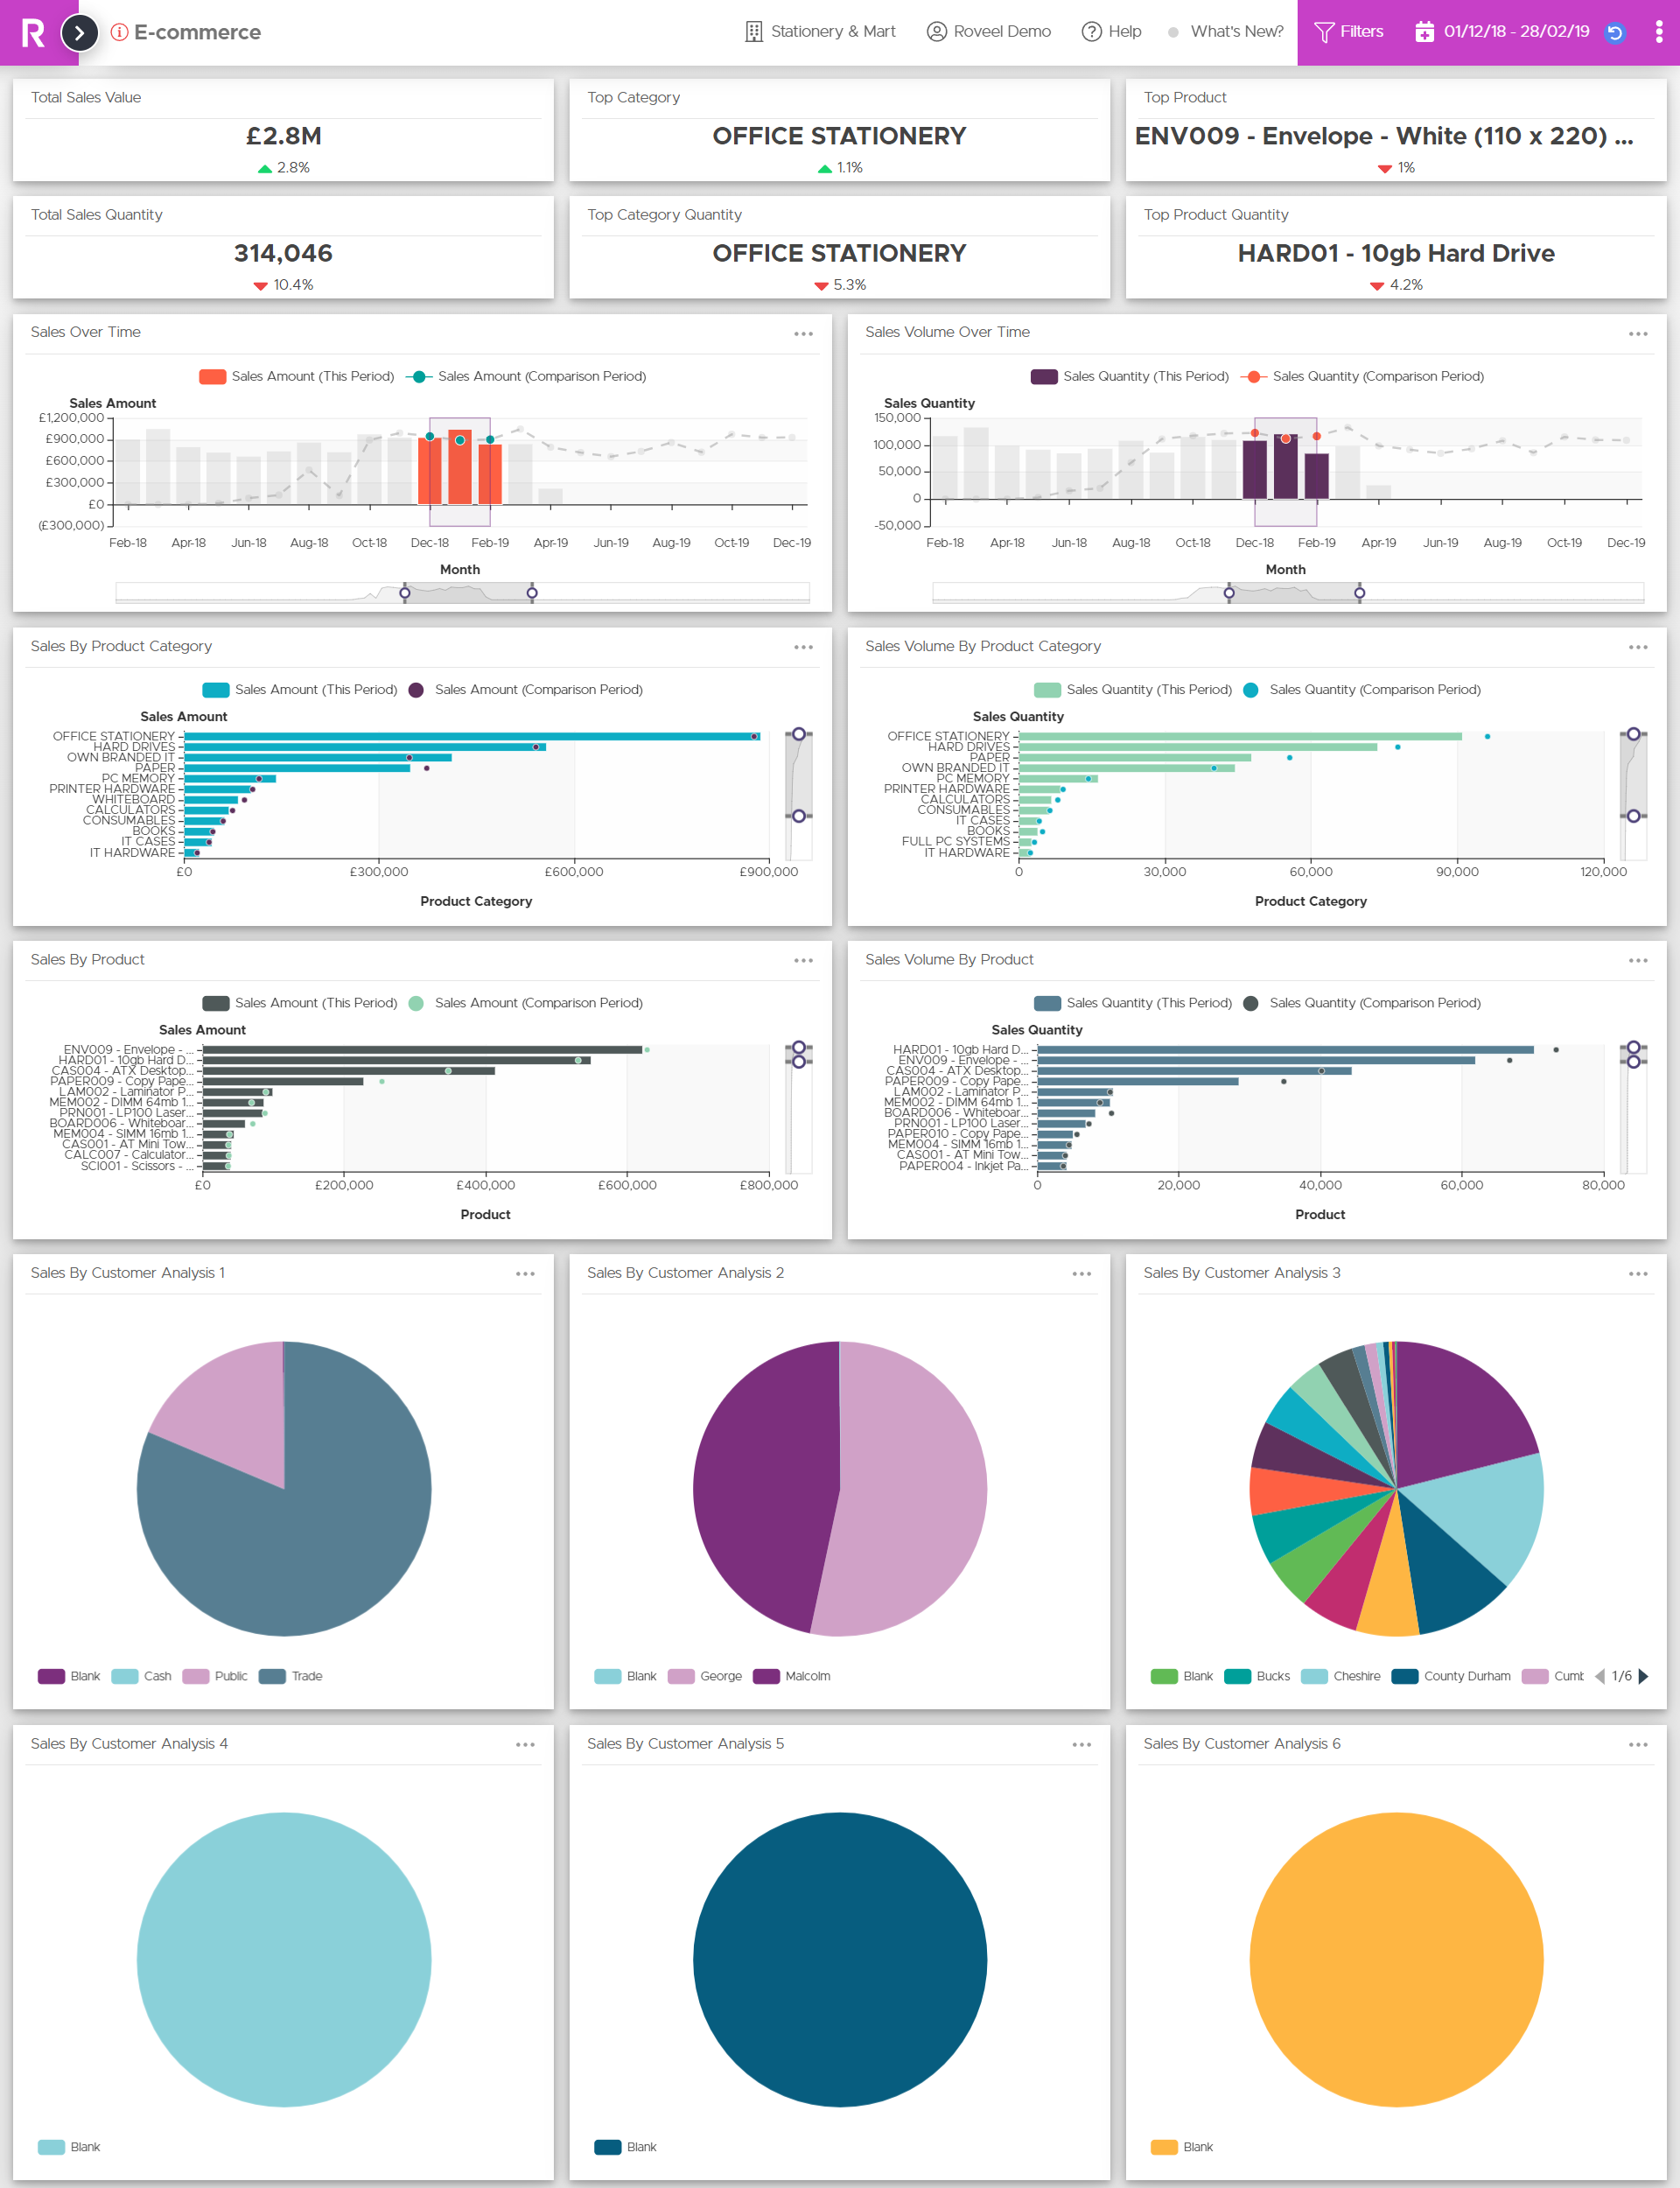
Introducing our latest dashboard tailored for Ecommerce businesses. This dashboard offers insights into essential customer and product data by the Customer Analysis fields, allowing you to pinpoint declining channels.
With a focus on key indicators such as turnover, sales value and volume by customer and product performance, you can now strategically target areas of your Ecommerce business that require immediate attention.
Dashboard Enhancements & Minor Tweaks
Customer Analysis Fields 1-6 Filters:
The following dashboards have been updated to include all six available Customer Analysis fields in their filters and charts (as applicable):
Credit Control Overview
Customer Analysis
Customer Information
Product Sales
Sales Targets
Service Sales Overview
Sales Overview
Supplier Analysis Fields 1-6 Filters:
The following dashboards have been updated to include all six available Supplier Analysis fields in their filters and charts (as applicable):
Supplier Information
Supplier Summary
Trade Creditors
Don’t use analysis fields in Sage? See more information here: https://roveel.zendesk.com/hc/en-gb/articles/360012248517-Sage-50-Entering-Customer-Supplier-Analysis-fields-in-Sage-
Project Dashboards:
Project Status now uses the user configured options found in Sage. Project statuses in Sage are used to control 1) when cost and revenue transactions are posted to your projects, 2) when groups or project items can be removed from a project’s hierarchy, 3) when your projects can be archived.
Quotations Summary:
The Quotations Summary dashboard now shows Order Analysis 1 – 3 as filter options.
Sales Order Summary:
Sales by Product & Product Category charts have now been added to the dashboard.
Order Number has been added as a filter option.
Sales Overview: Department has been added as a filter option.
