We are thrilled to introduce the latest enhancements to Roveel’s financial dashboard packages. These updates include our new marketplace Cash Bridge dashboard and the Rolling Last 12 Months P&L (LTM) dashboard, available to you for FREE.
How can these dashboards benefit your business?
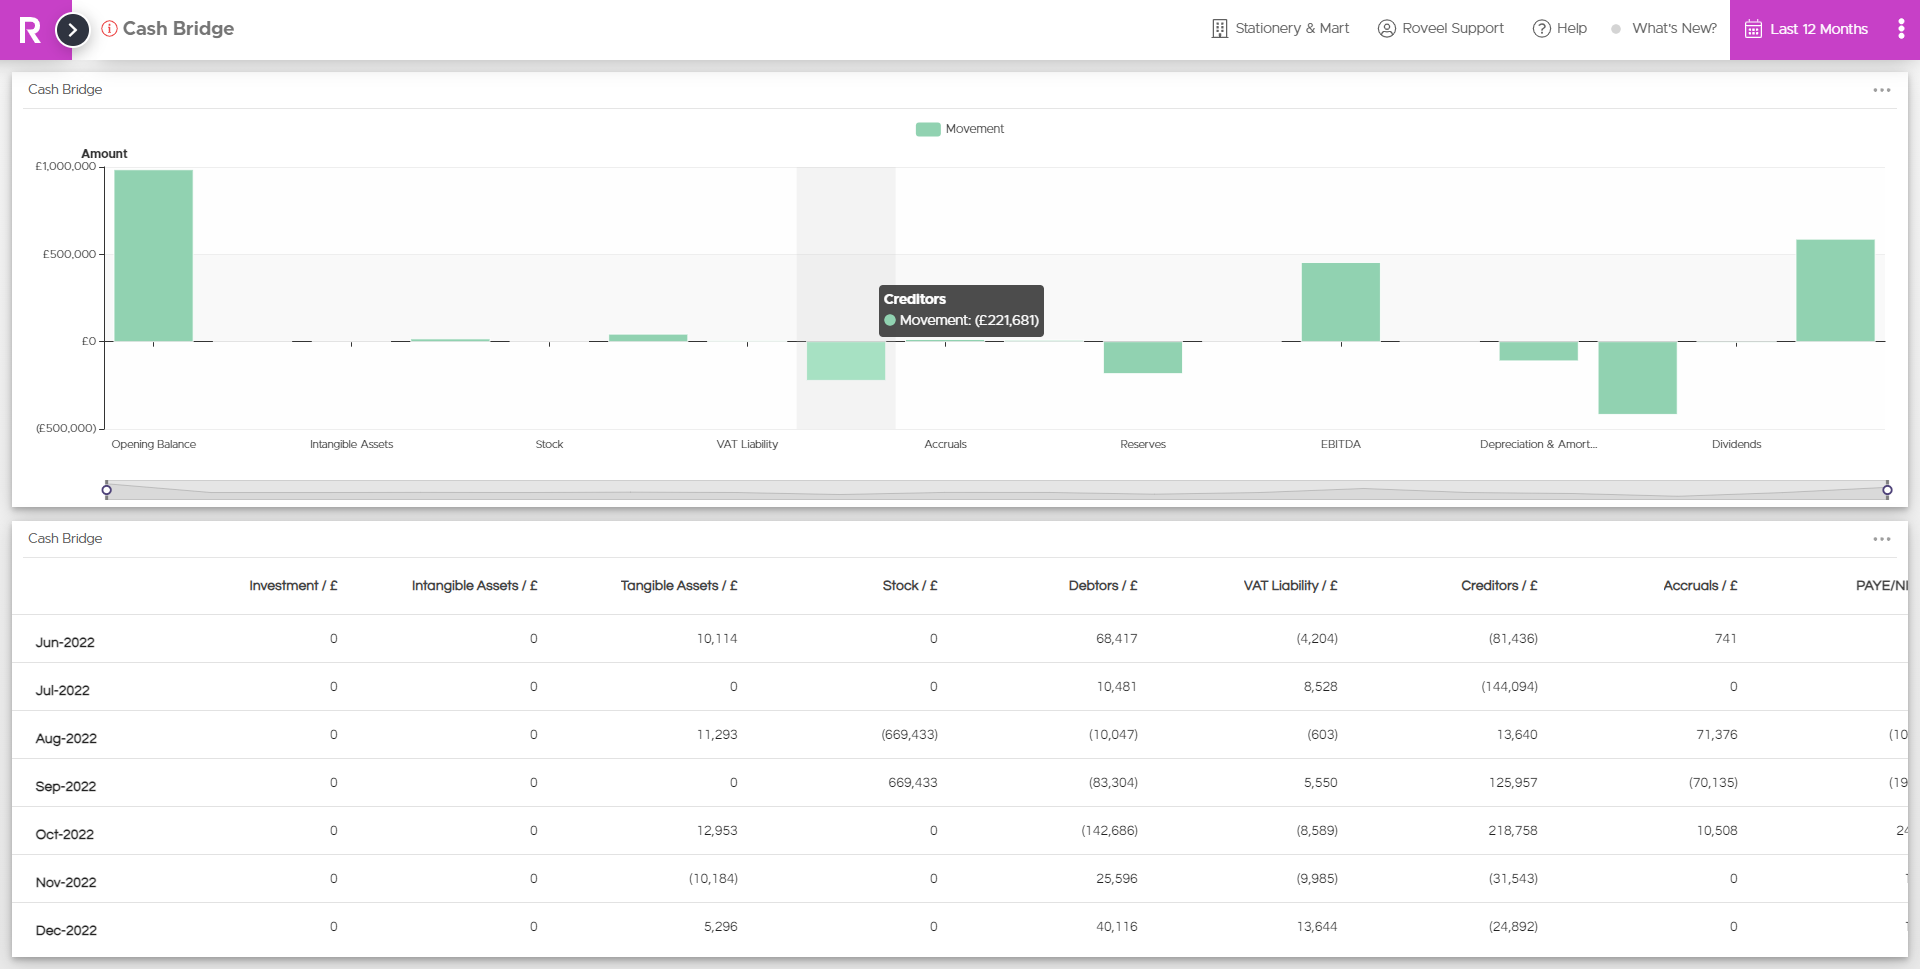
Cash Bridge
Are you looking to track changes in your cash position? Want to analyse how profits are converted into cash or how reducing stock value impacts your cash flow? Our new Cash Bridge dashboard provides valuable insights by summarising cash balance movements and showcasing how cash is generated or spent within your chosen timeframe.
Why is it valuable?
- Monitor cash flow: Gain instant visibility into the movement of cash within your business. By comparing starting and ending cash balances and analysing cash sources and uses, this dashboard enables you to identify potential cash flow issues before they become significant challenges. Stay ahead of the game and quickly recognise trends.
- Pinpoint cash management issues: The Cash Bridge dashboard is a powerful tool for pinpointing any cash management issues that require attention. It highlights excessive cash outflows or inefficient cash collections, allowing you to take proactive measures.
- Supports decision-making: The dashboard offers an instant overview of your business, saving you valuable time and eliminating errors associated with manual Excel-based reports. For instance, if you’re considering a new investment, the Cash Bridge report can help determine if your company possesses sufficient cash to fund it or if additional capital needs to be raised, considering the total cash generation over a specific period.
Take advantage of Roveel’s Cash Bridge and Rolling Last 12 Months (LTM) P&L dashboards to streamline your financial analysis and decision-making processes. Experience the benefits today by accessing these enhanced tools within our marketplace.
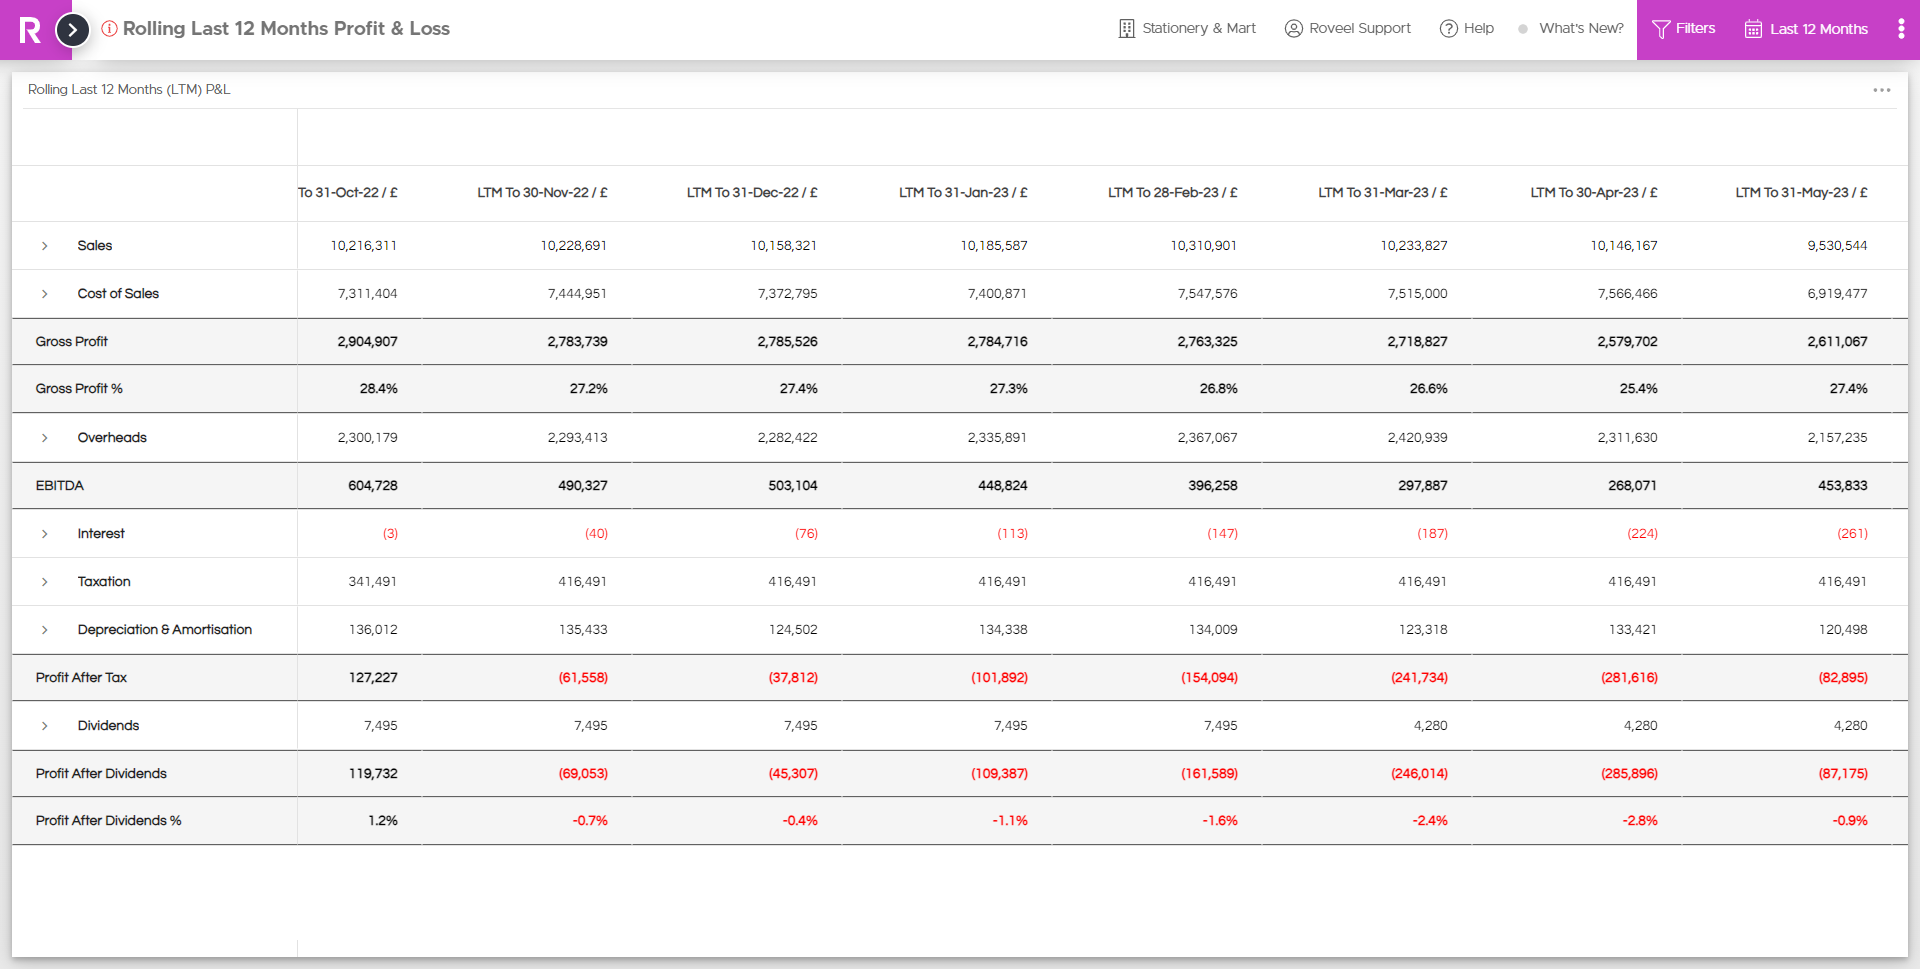
Rolling Last 12 Months (LTM) P&L
Introducing our new Rolling Last 12 months (LTM) Profit and Loss dashboard, a valuable tool for reviewing trading performance and tracking overall growth or decline trends in your business. A favourite of accountants and finance directors, this dashboard offers a continuous 12-month analysis on a month-by-month basis.
Why is it valuable?
- Helps with financial analysis and budgeting: The Rolling Last 12 Months P&L statement provides a comprehensive overview of your business’s financial performance over a longer period compared to traditional quarterly or annual reporting. This allows for a deeper understanding of revenue, expenses, and profitability trends, enabling informed financial analysis, forecasting, budgeting planning, as well as highlighting areas of concern and success.
- Supports decision-making: The Rolling Last 12 Months P&L Dashboard helps identify those sales or income lines which are growing, those which are experiencing a decline and ultimately a holistic view of the total business performance across the period, empowering you to make data-driven decisions.
- Facilitates compliance: The Rolling Last 12 months P&L supports accountants, advisors and business owners in having those meaningful conversations around current trends and business performance. It assists in identifying areas of opportunity for improvement and gaps in recording transactions appropriately.
Make the most of our Rolling Last 12 Months (LTM) Profit and Loss dashboard to gain valuable insights into your business’s financial performance. Learn more about the Rolling Last 12 Months Product Sales report.