Empower your organisation streamline reporting, enhance decision-making, and drive growth.
Roveel allows you to dive deep into your Xero & Sage data with drill-down analysis at the transaction level, uncovering insights beyond surface-level numbers.
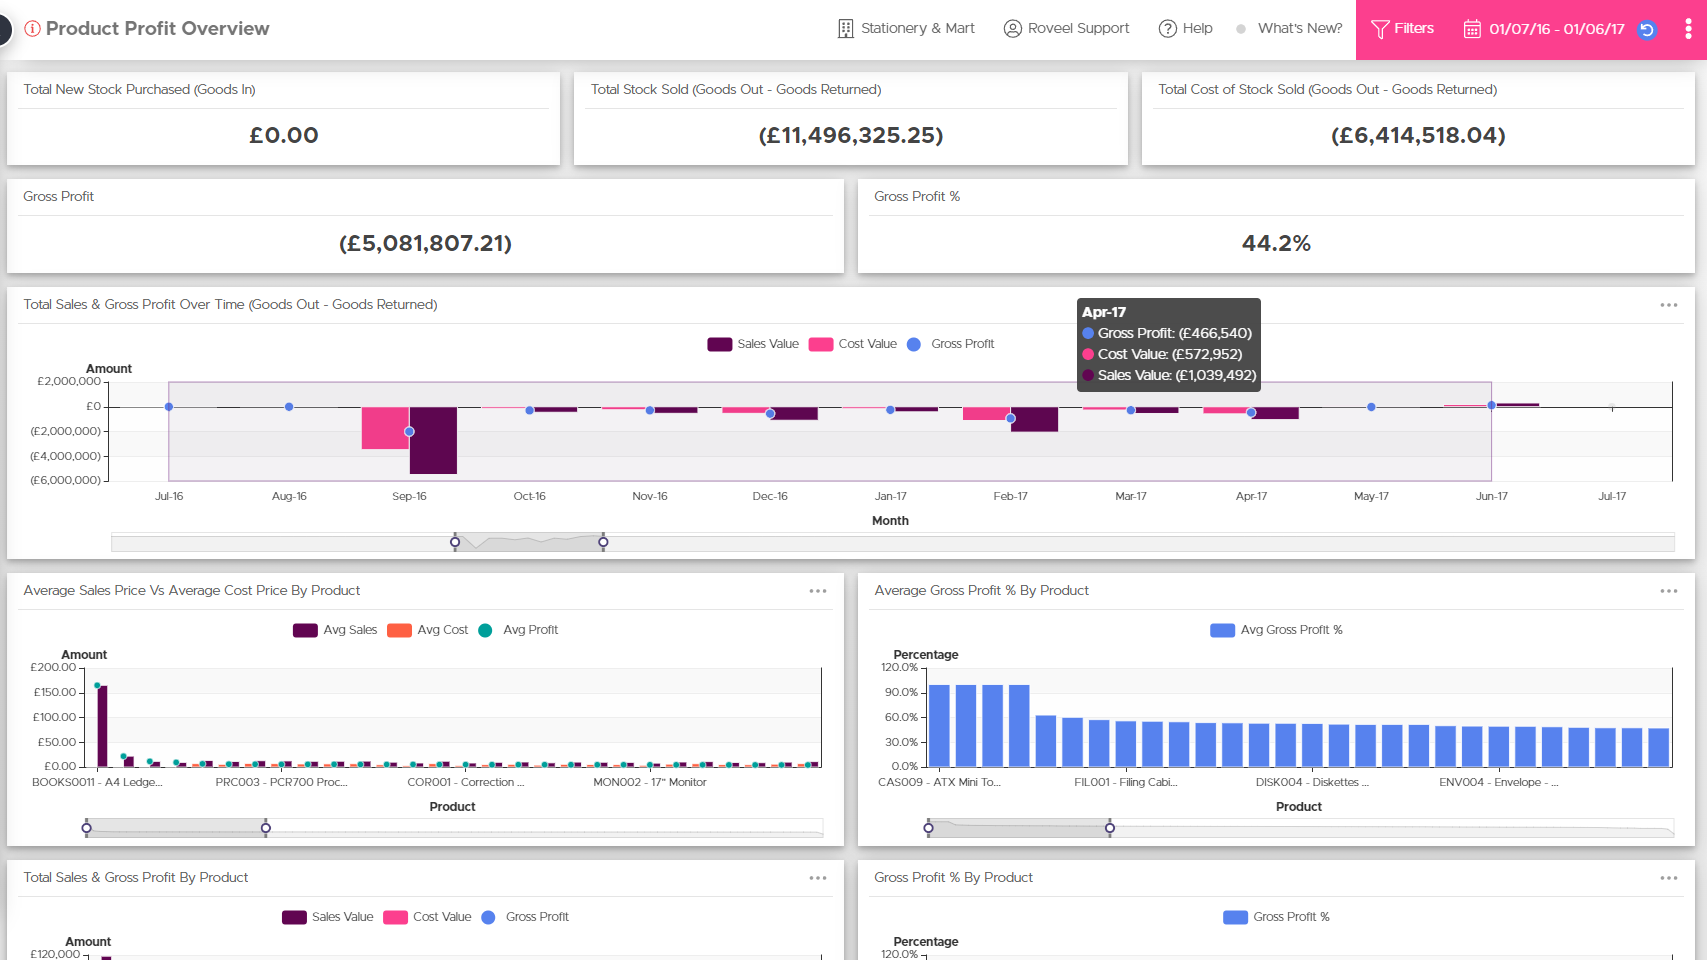
Track stock levels and valuations in real-time, ensuring that you always have a clear understanding of your inventory status.
Monitor sales trends across various products and customer segments with Roveel's robust analytics tools.
Anticipate cash shortages or surpluses, facilitating better financial planning and helping you maintain a healthy liquidity position for your business.
Leverage data-driven insights, you can optimise purchasing decisions, negotiate better terms, and strengthen relationships with your suppliers.
Analyse customer payment patterns, you can improve credit control and tailor your strategies to enhance customer relationships.
Address the unique challenges of wholesale businesses, offering features that streamline inventory management, sales tracking, and cash flow analysis.
Tailor your dashboards to focus on the metrics that matter most to your business. Roveel creates personalised reports, making it easier to monitor performance and track key indicators relevant to your wholesale operations.
Access your data anytime, anywhere with Roveel's secure cloud-based dashboards & reports, enabling real-time insights from any device.
With its intuitive design, Roveel makes it easy for users at all levels to navigate the platform and utilise its features effectively, ensuring a smooth experience for your team.
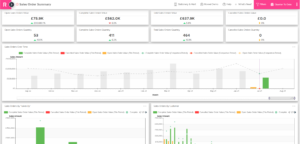
Keep track of your open and fulfilled sales orders.
Monitor product sales value over the last twelve months.
Visualise profit margins across your product range.
Identify inventory items with low turnover.
Instantly understand your profitability. Which customers, departments, regions, sales people are yielding the most (and least) profit to the business. Easy and quick to access from anywhere.
Access new sales data, unlocking trends and insights at product and customer level obtaining deep insights into your customers spend behaviour.
Our customisation service enabled SaxonAir to gain instant insight over the company's flight profitability.
Hear from Craig at Seneye who uses Roveel every day to identify and narrow in on sales opportunities.

"The whole process took an hour. Once loaded up, it was phenomenal."
"Roveel and the KPI dashboards built for us have helped with our ISO accreditation."

Discover the impact Roveel can have on your business. Get your free 14-day trial today.

Vibrant, insightful & drill-down cloud based dashboards for Sage and Xero. Improved decision making in an instant.


To provide the best experiences, we use technologies like cookies to store and/or access device information. Not consenting or withdrawing consent, may adversely affect certain features and functions.