This December we are bringing you the latest Dashboards available in Roveel for Sage Accounting:
 New Free Dashboards (included as part of your subscription):
-
Profit and Loss
-
Profit and Loss Monthly
-
Balance Sheet
-
Balance Sheet Monthly
-
Rolling Last 12 Months (LTM) Profit and Loss
New Marketplace Dashboards
-
Transaction Analysis Profit and Loss
-
Budget vs. Actual, Visual Budget Profit and Loss – Import your budgets into Roveel
-
Visual Profit and Loss
-
Rolling LTM Customer Sales, Product Quantity and Product Sales
New Dashboards (included as part of your subscription)
Profit and Loss & Balance Sheet Dashboards (FREE)
Effortlessly streamline all your financial reporting requirements within Roveel’s set of financial dashboards integrated with Sage Accounting. The Profit and Loss and Balance Sheet dashboards remove the need for multiple tools and manual excel sheets, ensuring you gain accurate insights that drive your decision-making processes.
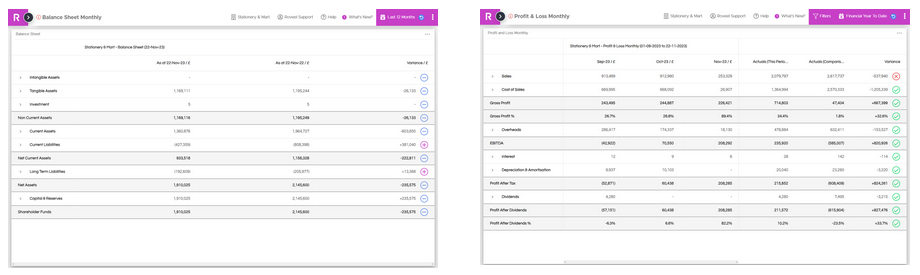
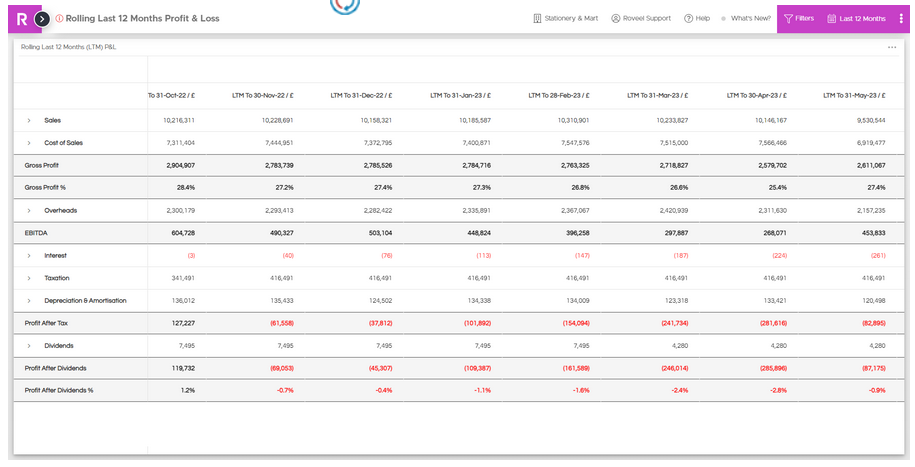
Rolling LTM Profit and Loss (FREE)
Introducing our new Rolling LTM Profit and Loss dashboard for Sage Accounting, a valuable tool for reviewing trading performance and tracking overall growth or decline trends in your business. A favourite of Accountants and Finance Directors, this dashboard offers a continuous 12-month analysis on a month-by-month basis.
New Marketplace Dashboards
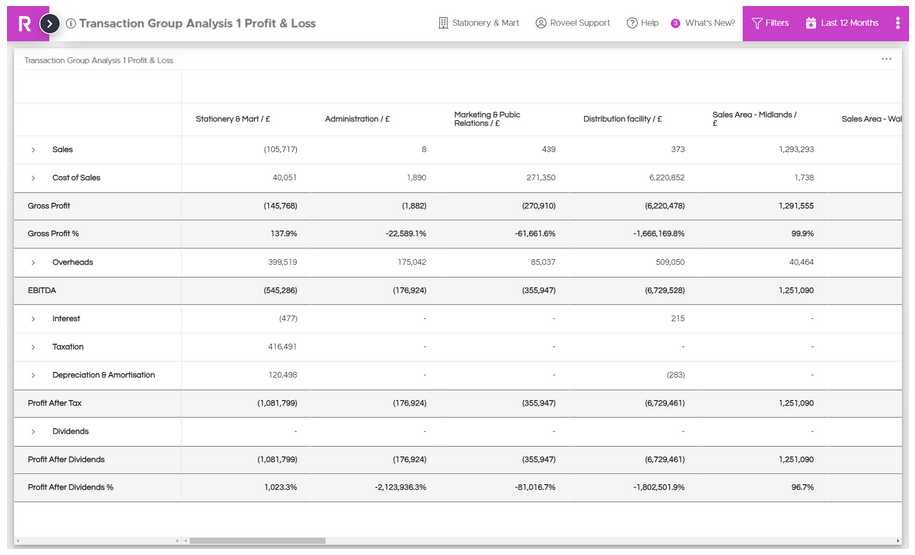
Transaction Analysis Profit and Loss
Address your reporting hurdles within Sage Accounting with our innovative Transaction Analysis Profit and Loss Dashboards. Using the Transaction Group Analysis Fields 1-3 and Roveel, you can efficiently generate three distinct accounts to enhance your Profit and Loss Management Account report generation.
What is the difference between Transaction and Group Analysis?
View Transaction Analysis Dashboard
Budgets
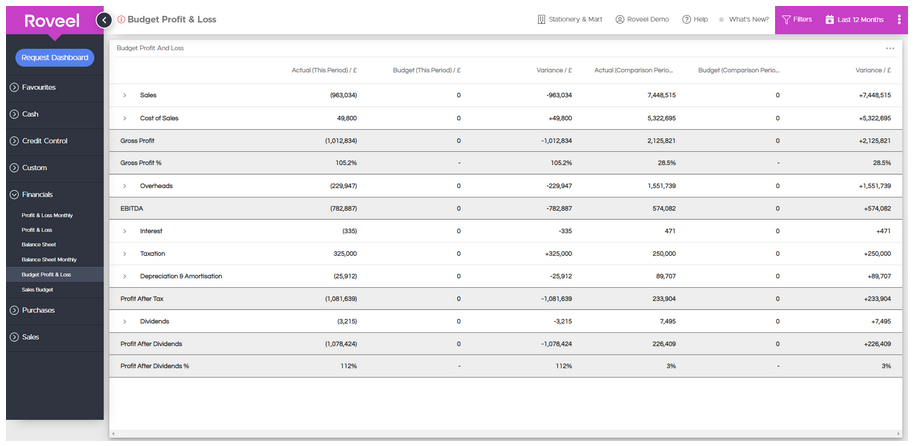
Roveel now enables Sage Accounting users to utilise budgets as part of their reports. You can now import your budgets straight into Roveel from Excel using our custom import templates.
Budget vs. Actual Profit and Loss
Keep your teams on track and effectively monitor your account spends against budgets. Maintain a clear overview of your financial performance, ensuring alignment with your budgetary objectives.
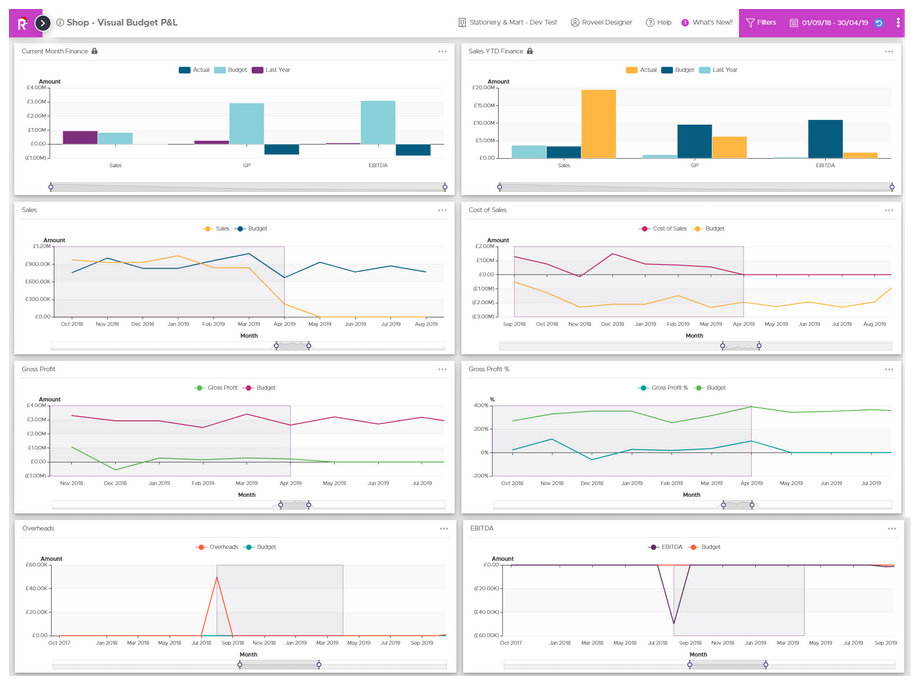
Visual Budget P&L
Track your performance with respect to your budgets and assess visually if you are on-track, falling short, or surpassing your budgets and goals.
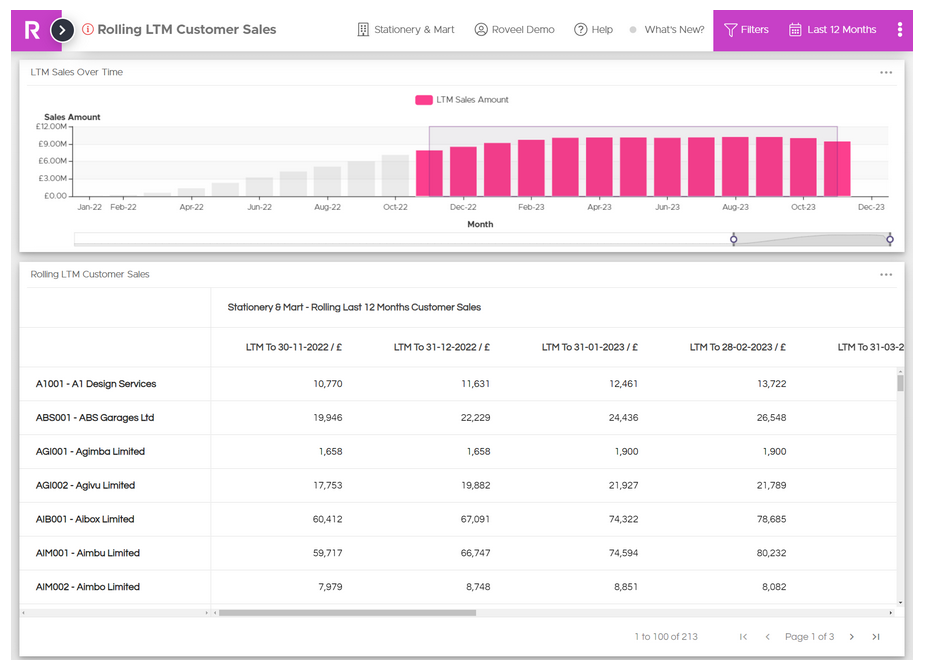
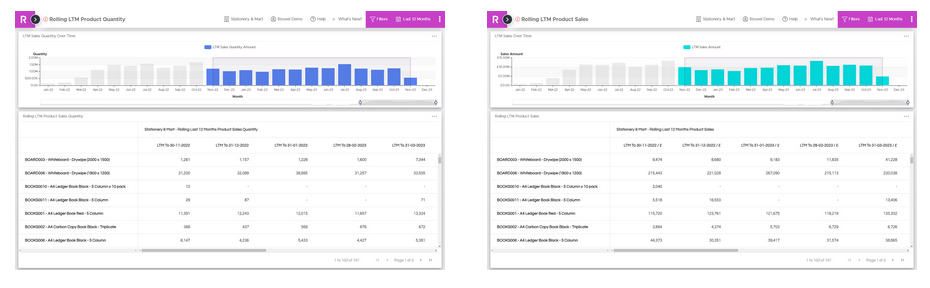
LTM Customer Sales, Product Quantity and Product Sales
Gain an overview of your customer and product sales/quantity over a full year. Identify the trends of your customer sales, enabling you to instantly detect which month a customer sales start to decline and use the data from Roveel to identify opportunities early.
View Rolling LTM Product Quantity View Rolling LTM Product Sales
View Rolling LTM Customer Sales