We are bringing you the latest updates, news and features from Roveel.
New Dashboard (included with your subscription):
-
Monthly Customer Sales
New Marketplace Dashboards
-
Pareto Analysis (Sage Accounting & Sage 50)
Dashboard Enhancements & Minor Tweaks
-
Transaction Table Improvements
-
Colours – All Dashboards
New Dashboards (included as part of your subscription)
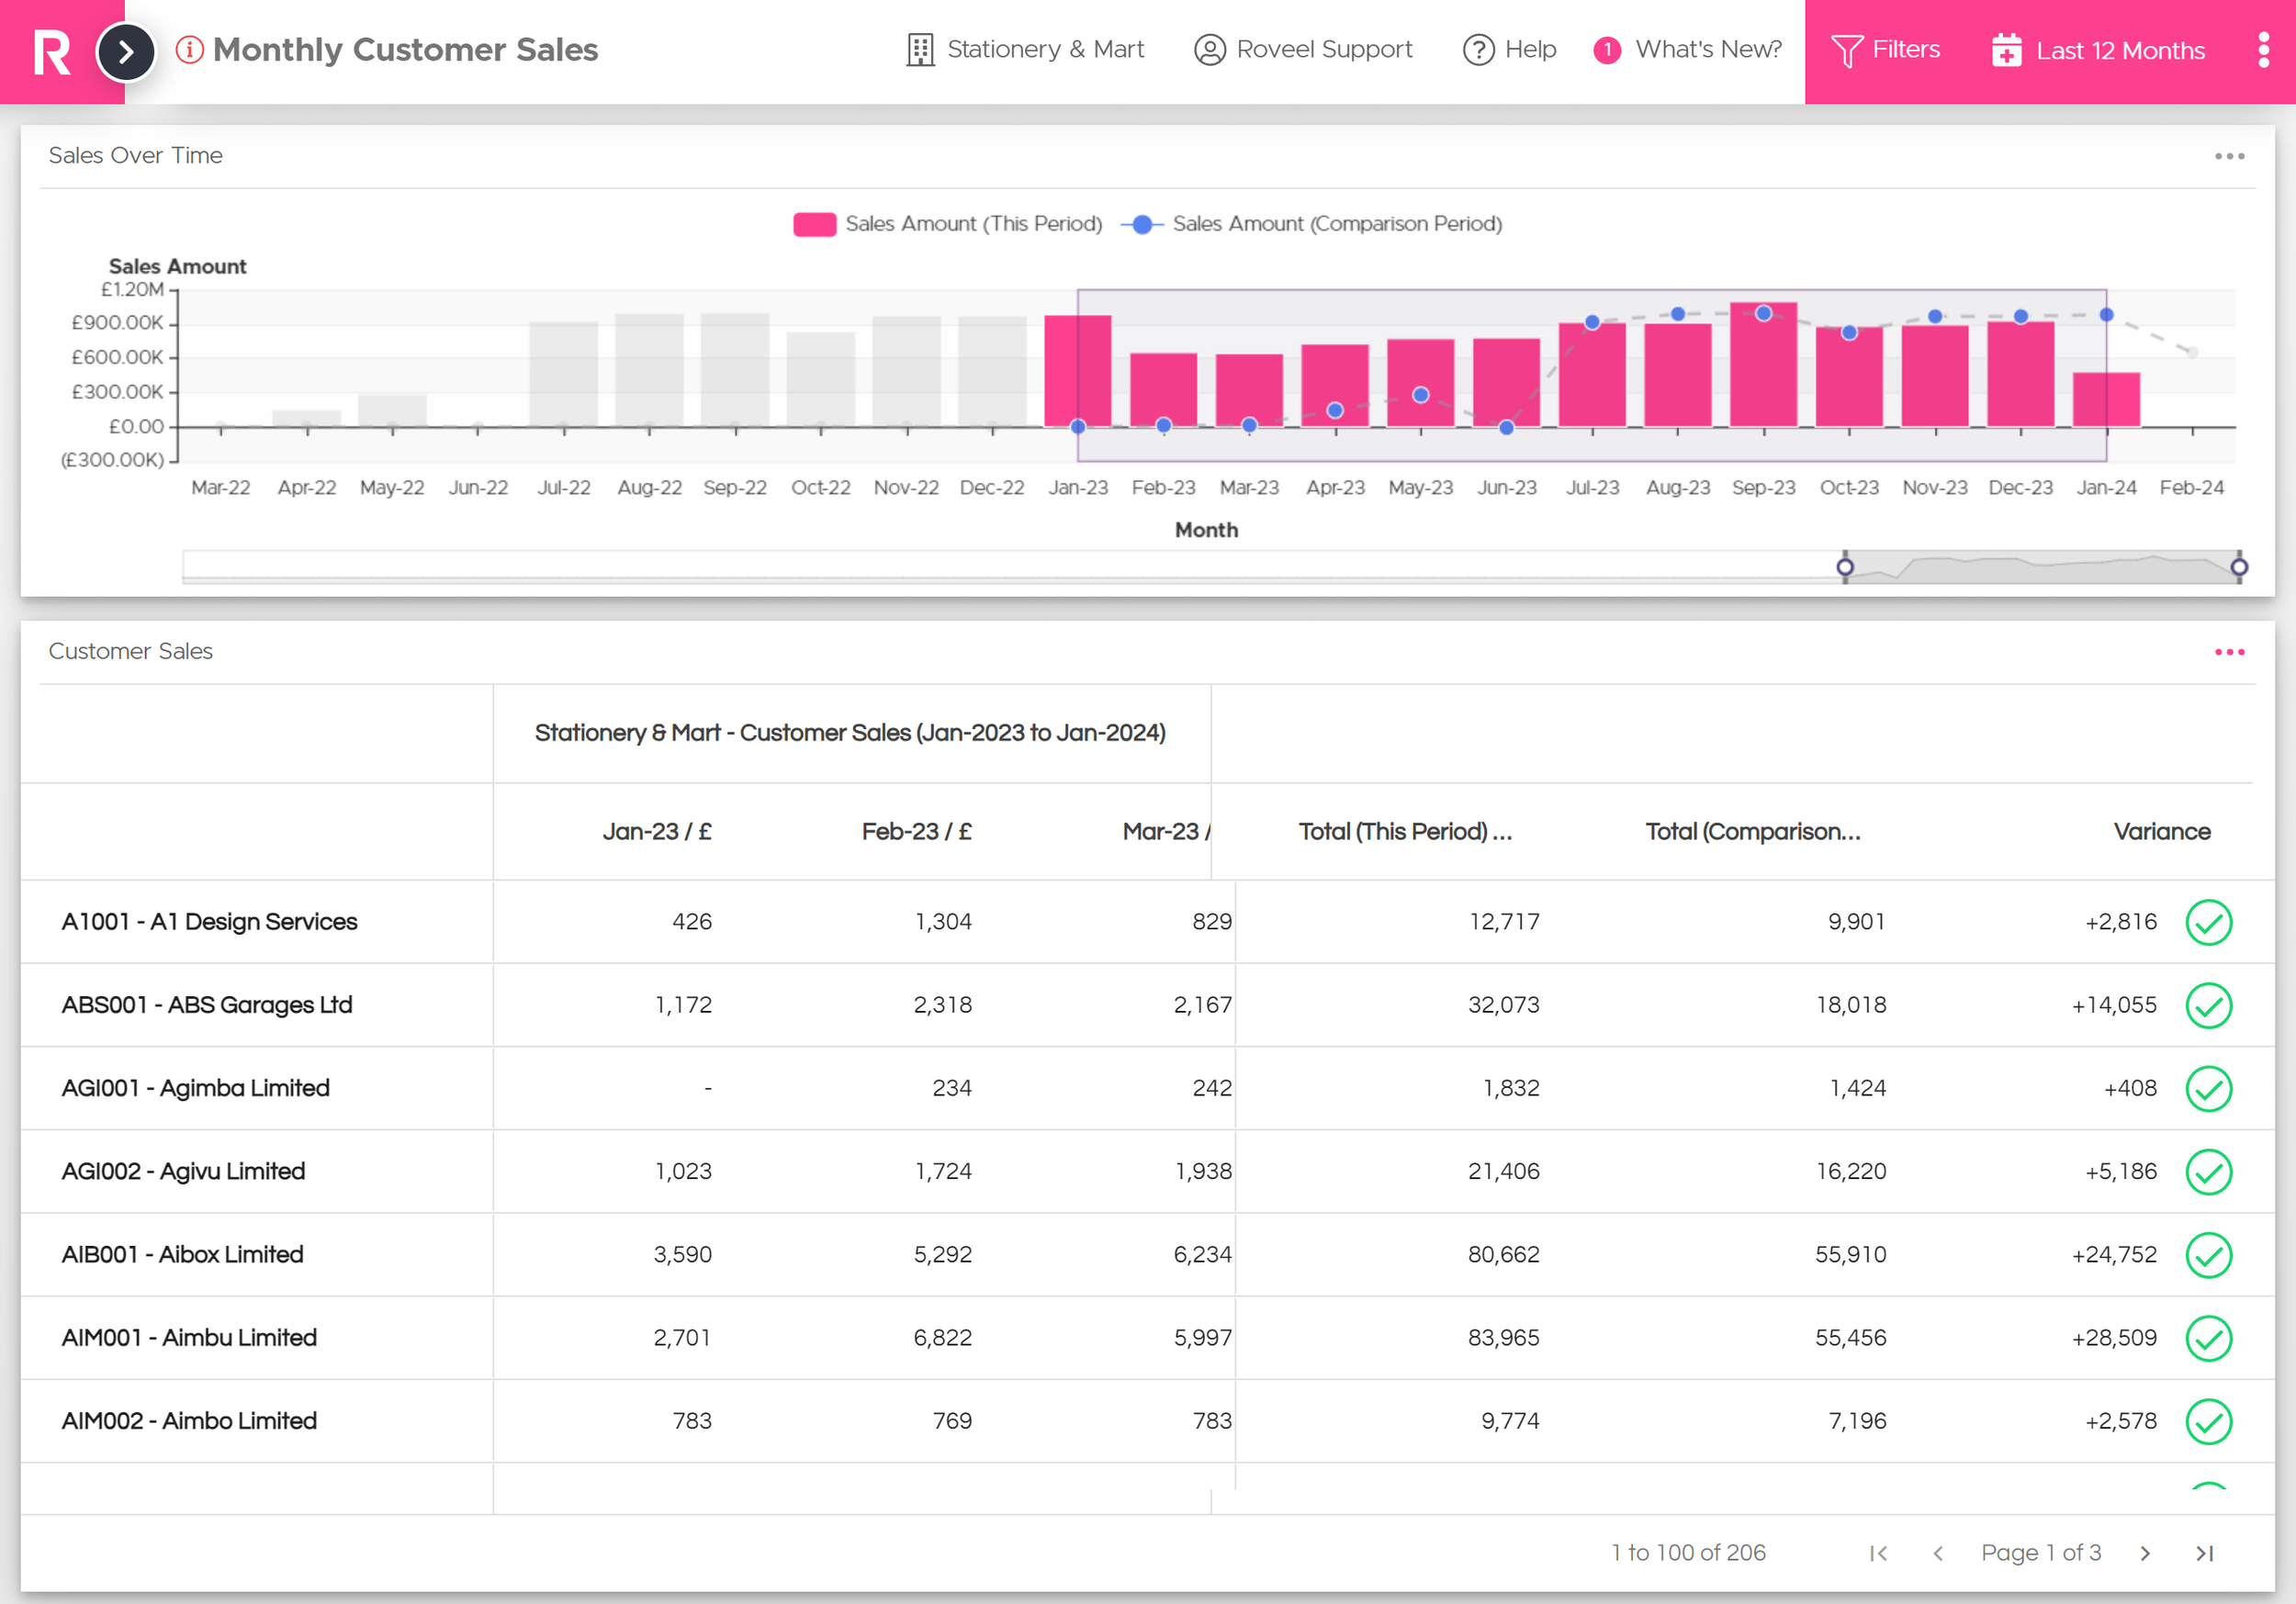
Monthly Customer Sales
Evaluate your sales data with our new month-by-month customer sales dashboard. Identify potential sales opportunities by gaining insights into spending patterns and seasonal trends throughout the year.
New Marketplace Dashboards
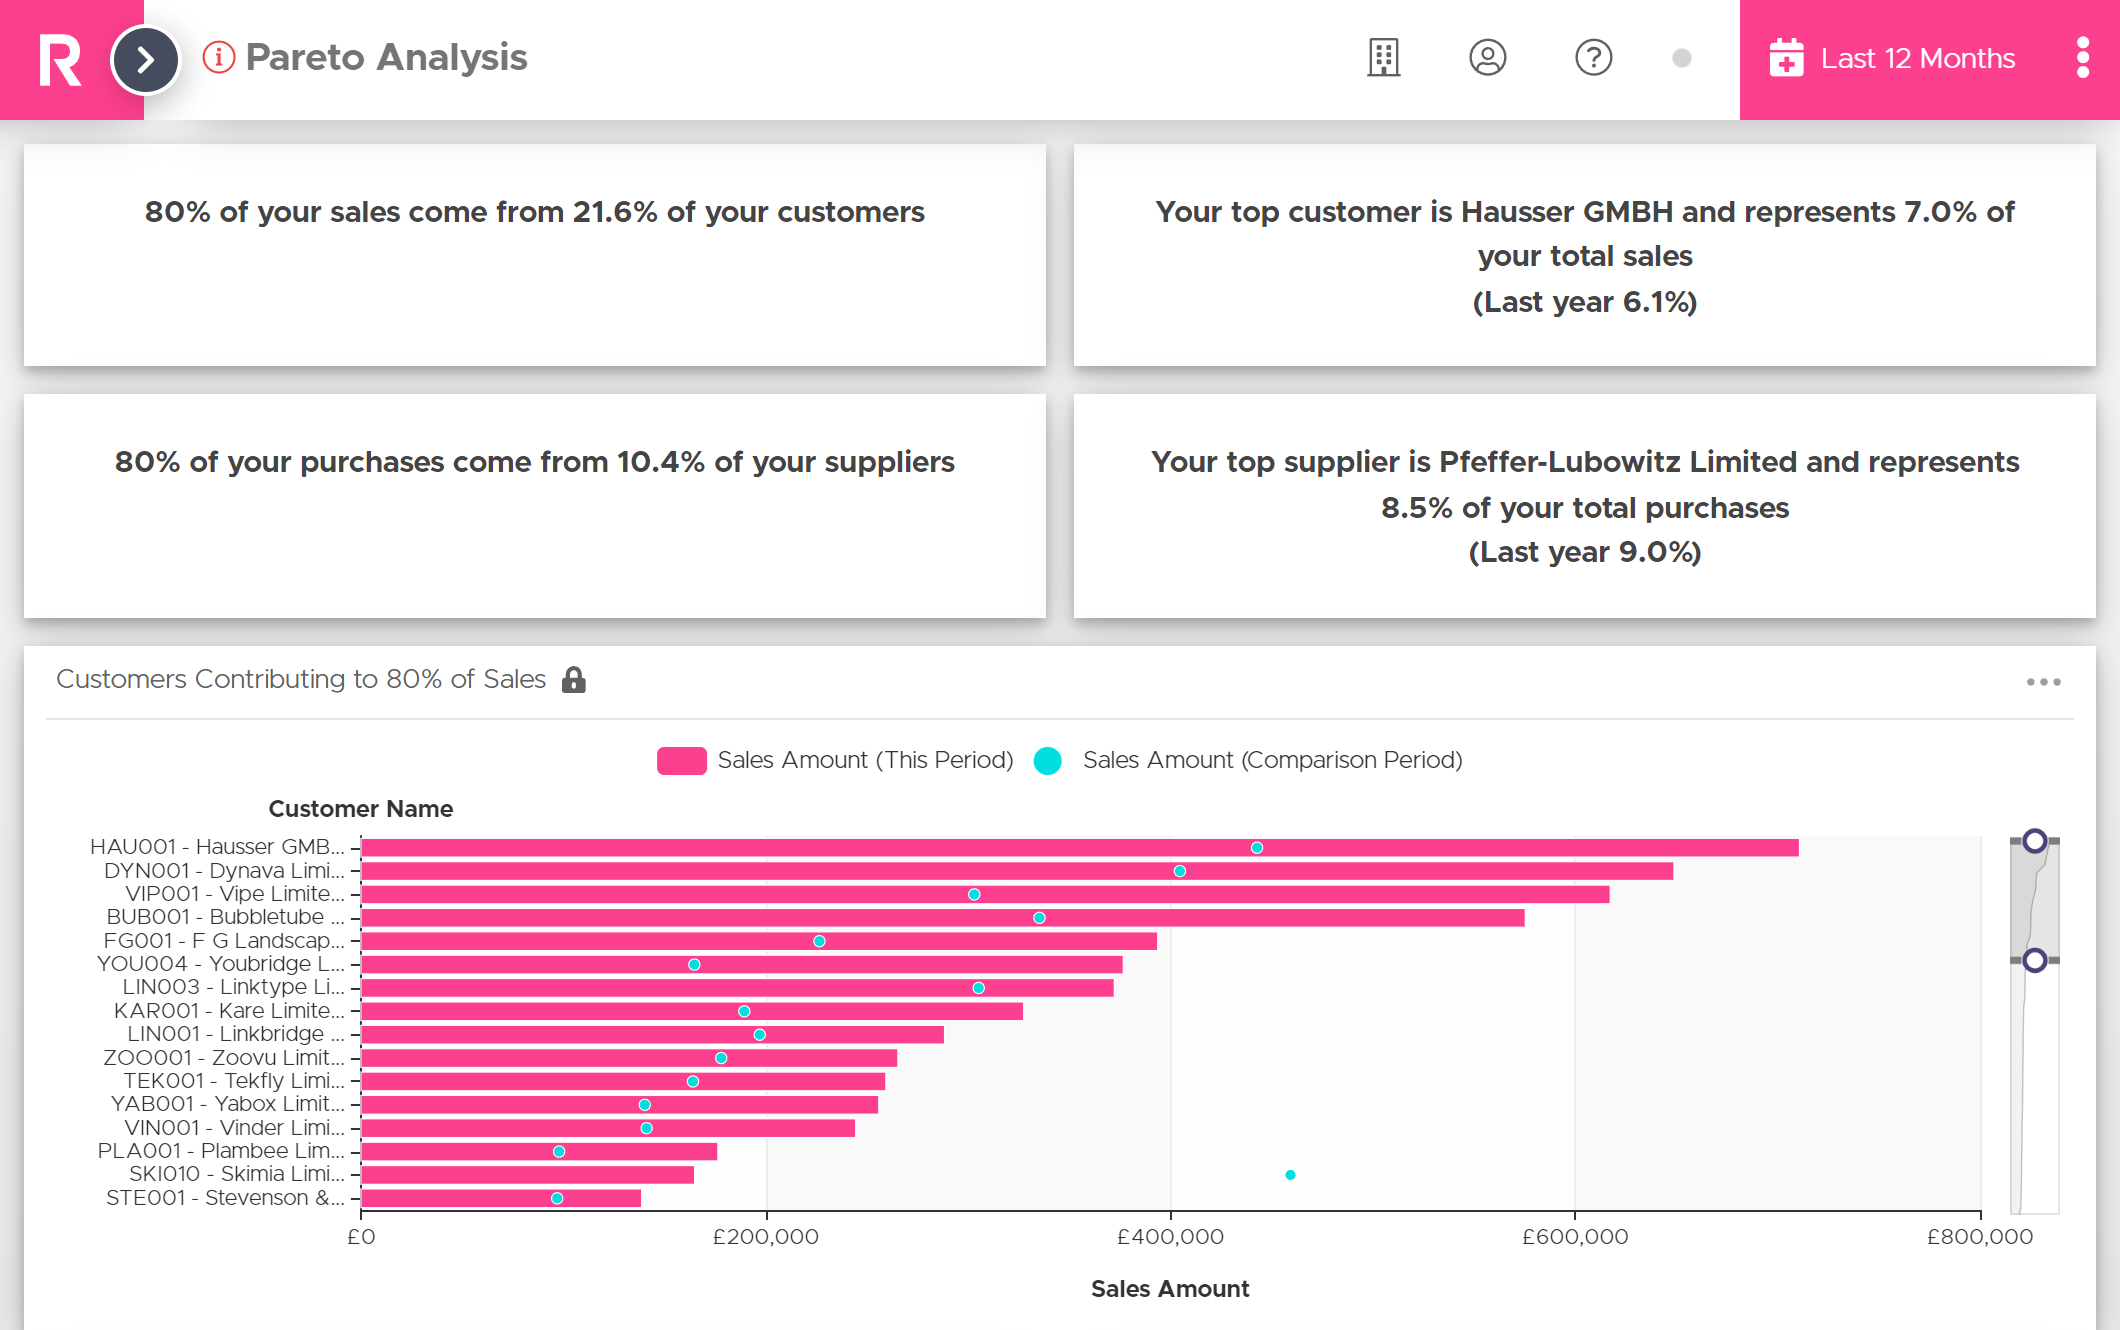
Pareto Analysis
Often referred to as the 80:20 split, Pareto Analysis displays the critical 20% of your customers, suppliers, and products that have played a key role in generating 80% of your sales and purchases. Identify business opportunities and pinpoint those high impact areas across your business.
Pareto Analysis helps identify areas of focus, aiding in the planning and targeting of your most important customers, products and suppliers essential to grow your business.
View Pareto Analysis Dashboard
Dashboard Enhancements & Minor Tweaks
Transaction Table Improvements
We are pleased to announce several upgrades to the transaction tables within our Finance dashboards:
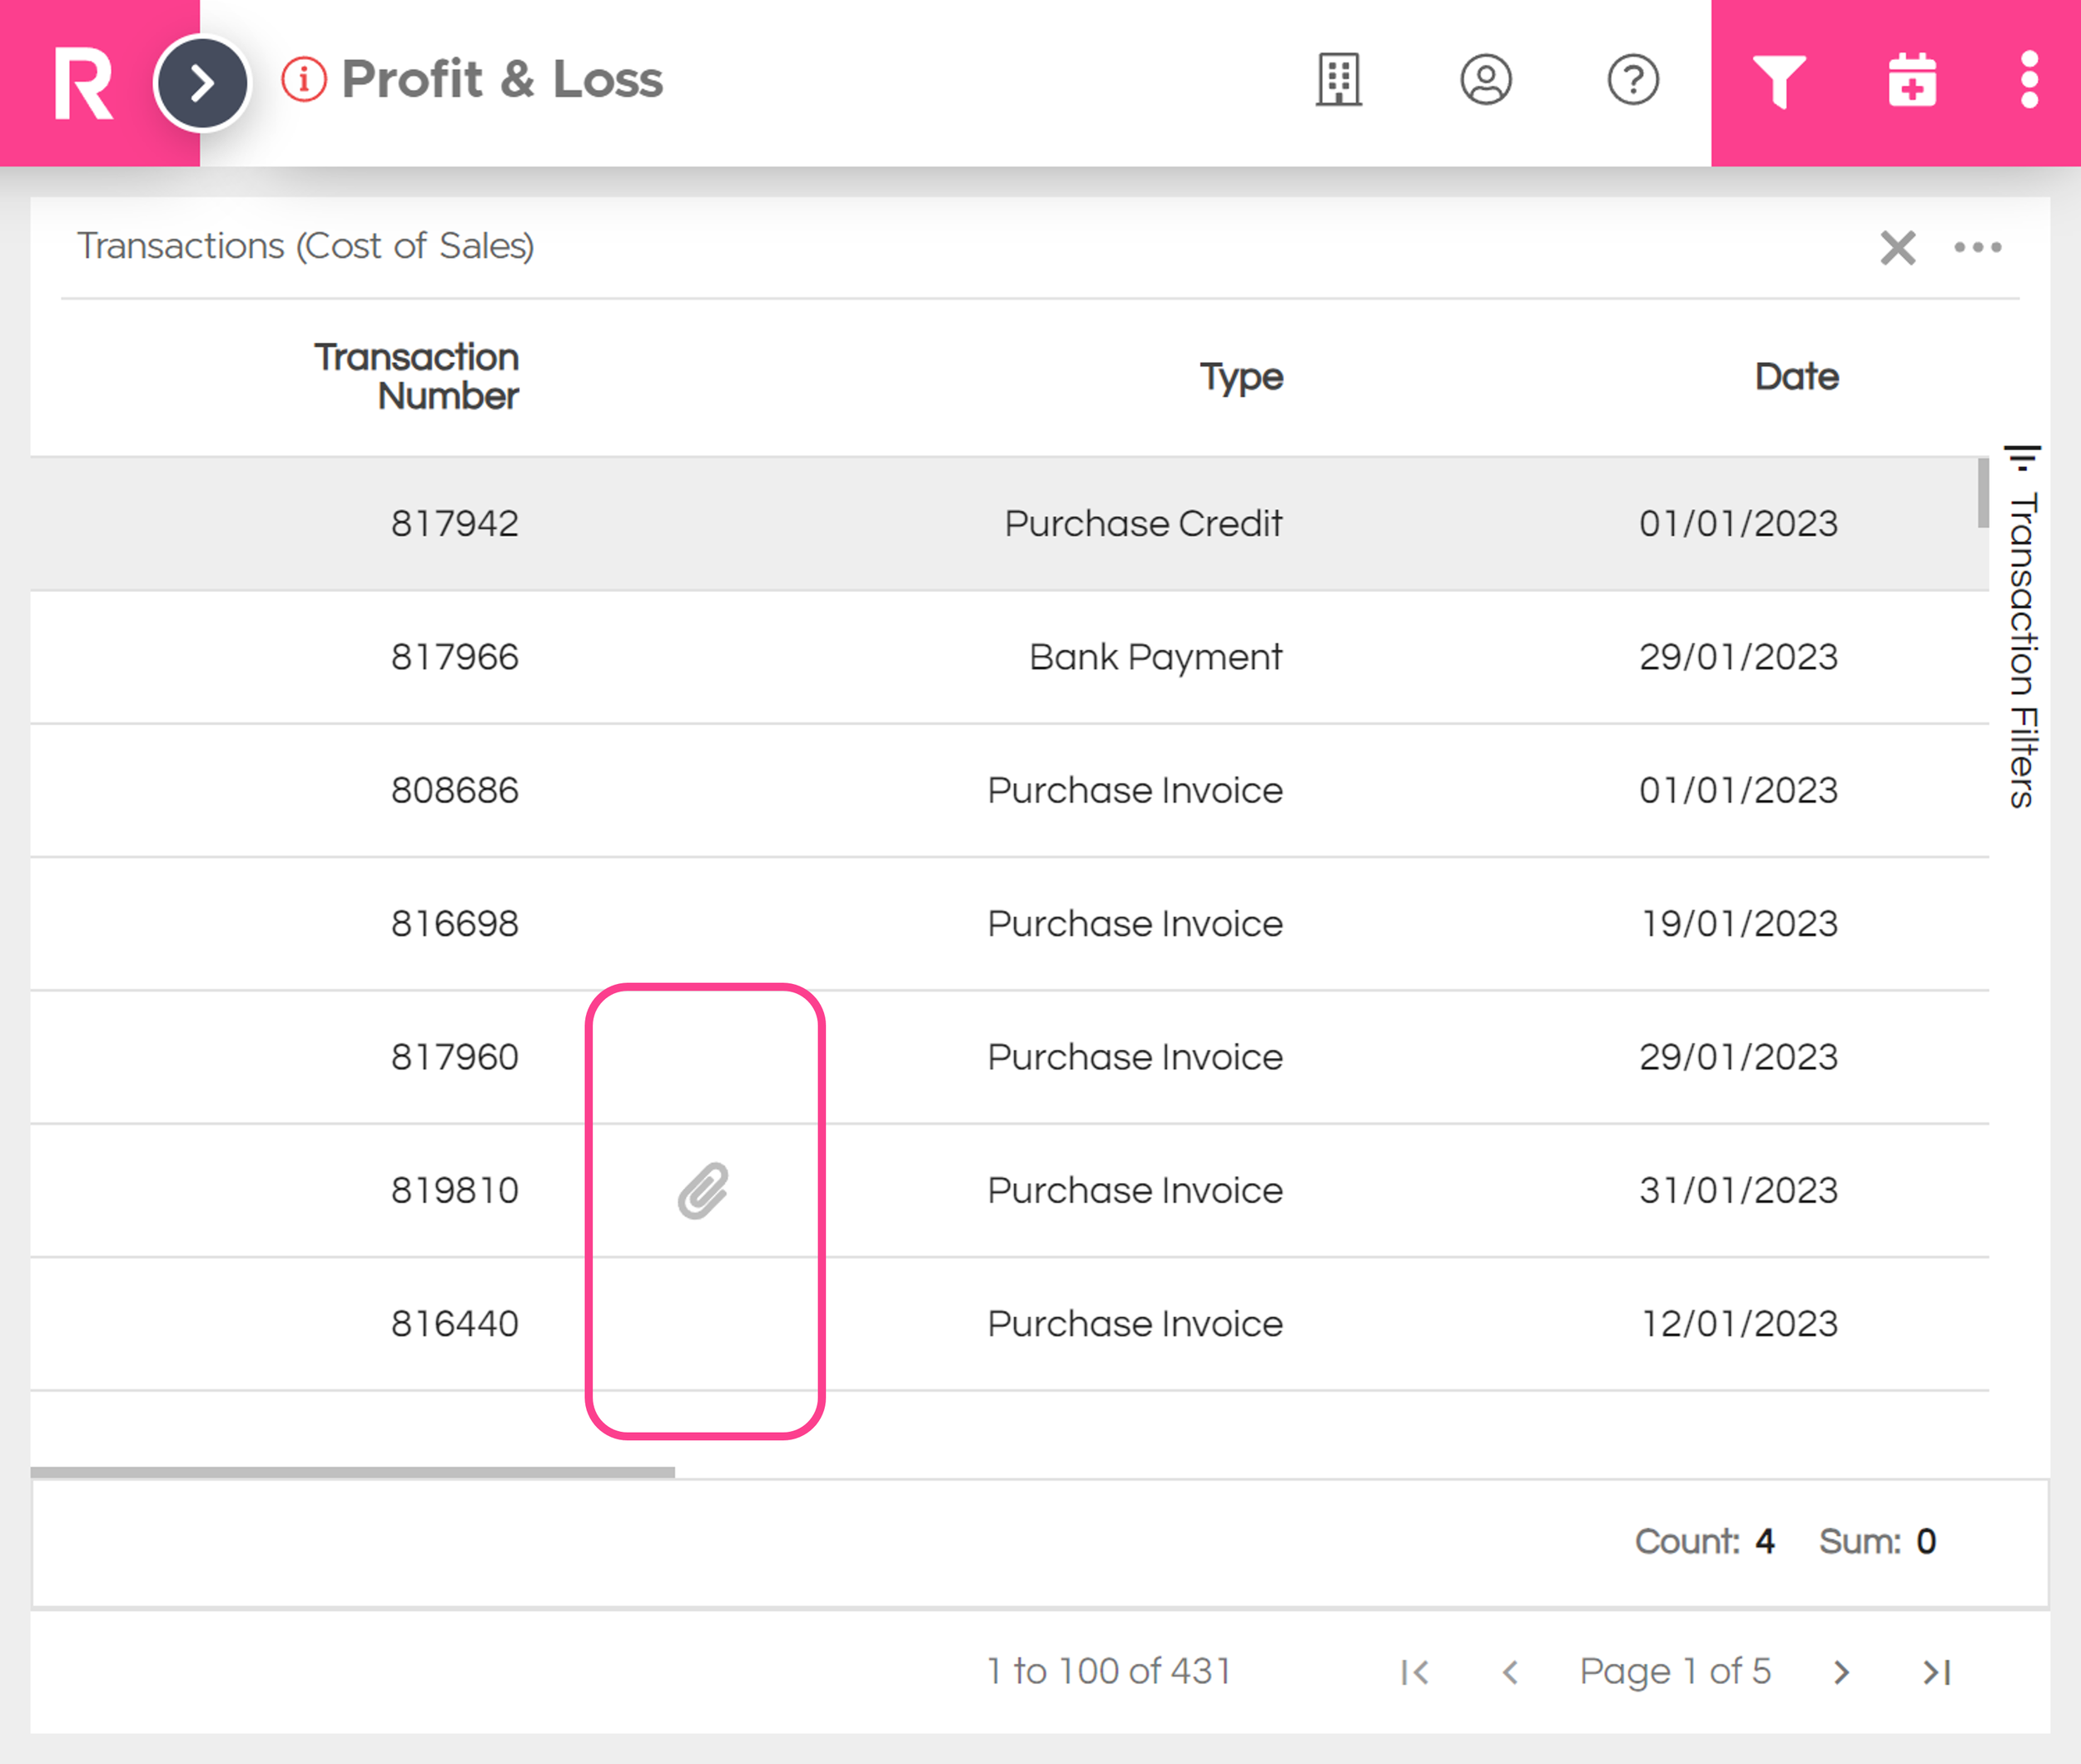
AutoEntry Invoice Access:
AutoEntry customers can now access their purchase invoices associated with transactions. Simply click on the paperclip symbol located next to the relevant transaction:
Sum Calculator – Enhanced Functionality for Finance Tables:
We have introduced a new sum feature to our default table-based dashboards. You can now sum figures in your tables by either:
-
Dragging to highlight figures
-
Holding down Ctrl and clicking on the figures you wish to sum
The total figures will be calculated and displayed in the bottom right-hand corner of the table.
This feature is now live on the following dashboards for both Sage 50 and Sage Accounting.
-
Budget P&L
-
Profit & Loss
-
Profit & Loss Monthly
-
Balance Sheet
-
Balance Sheet Monthly
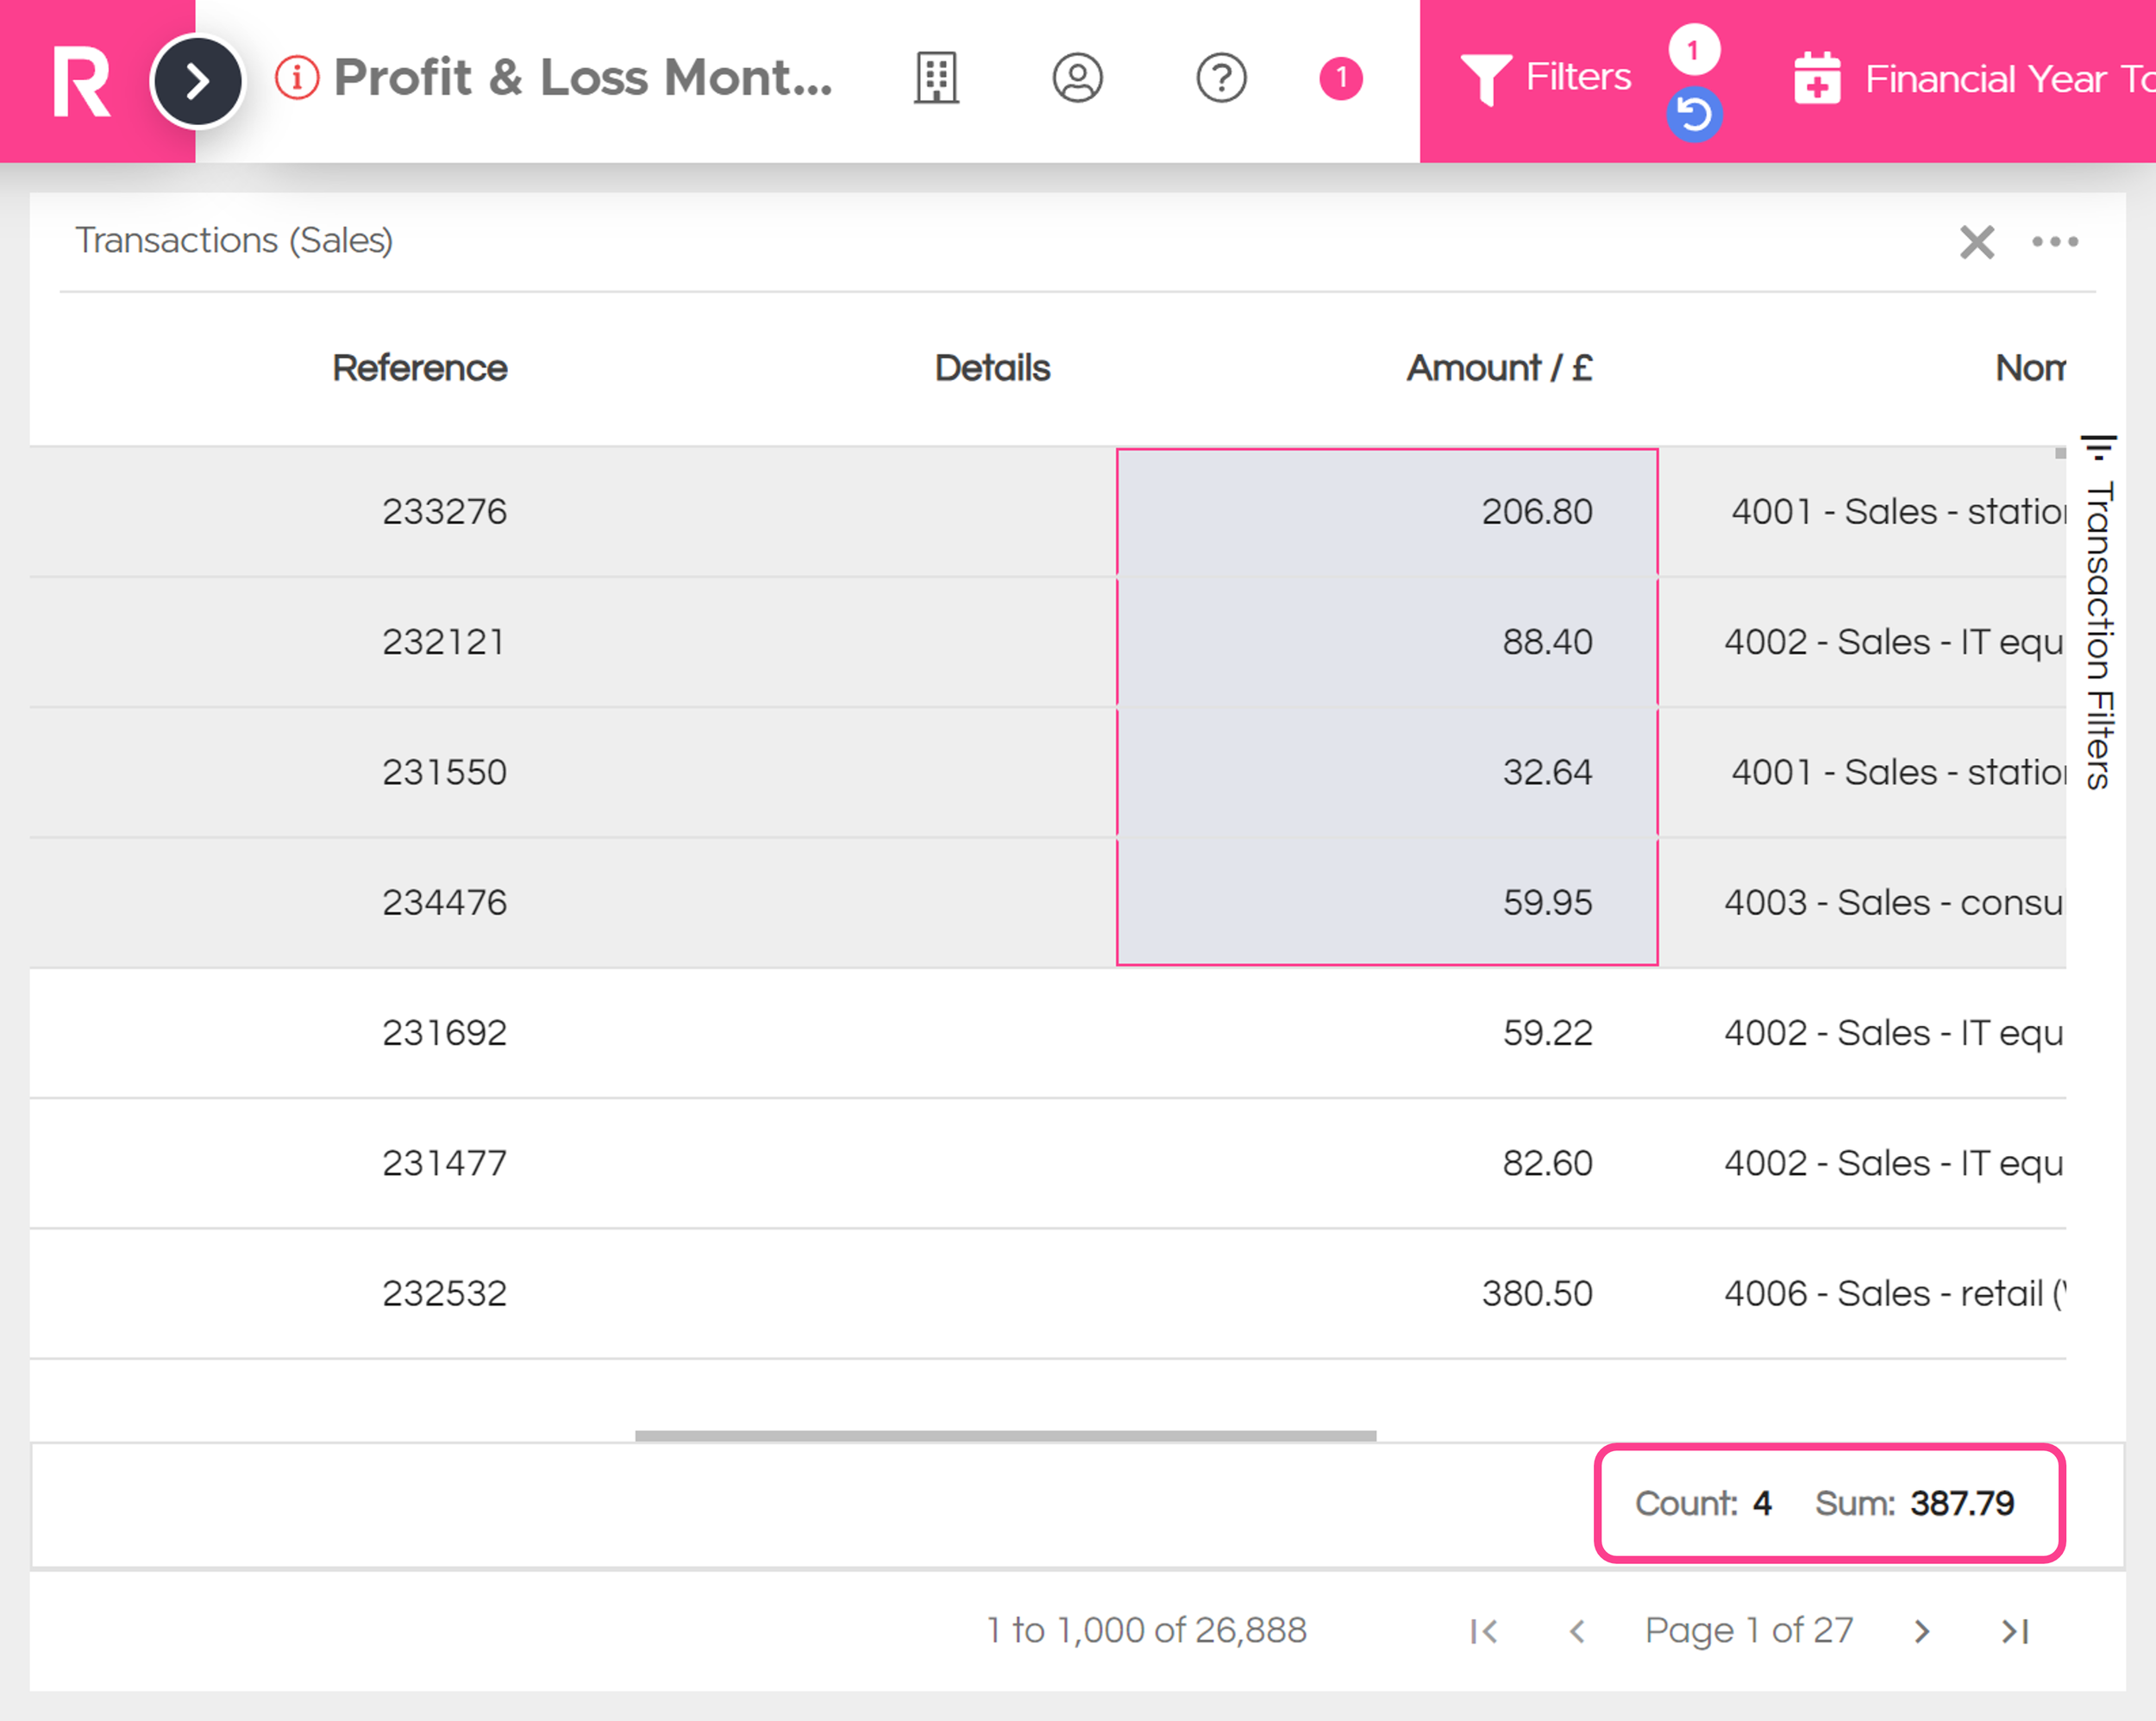
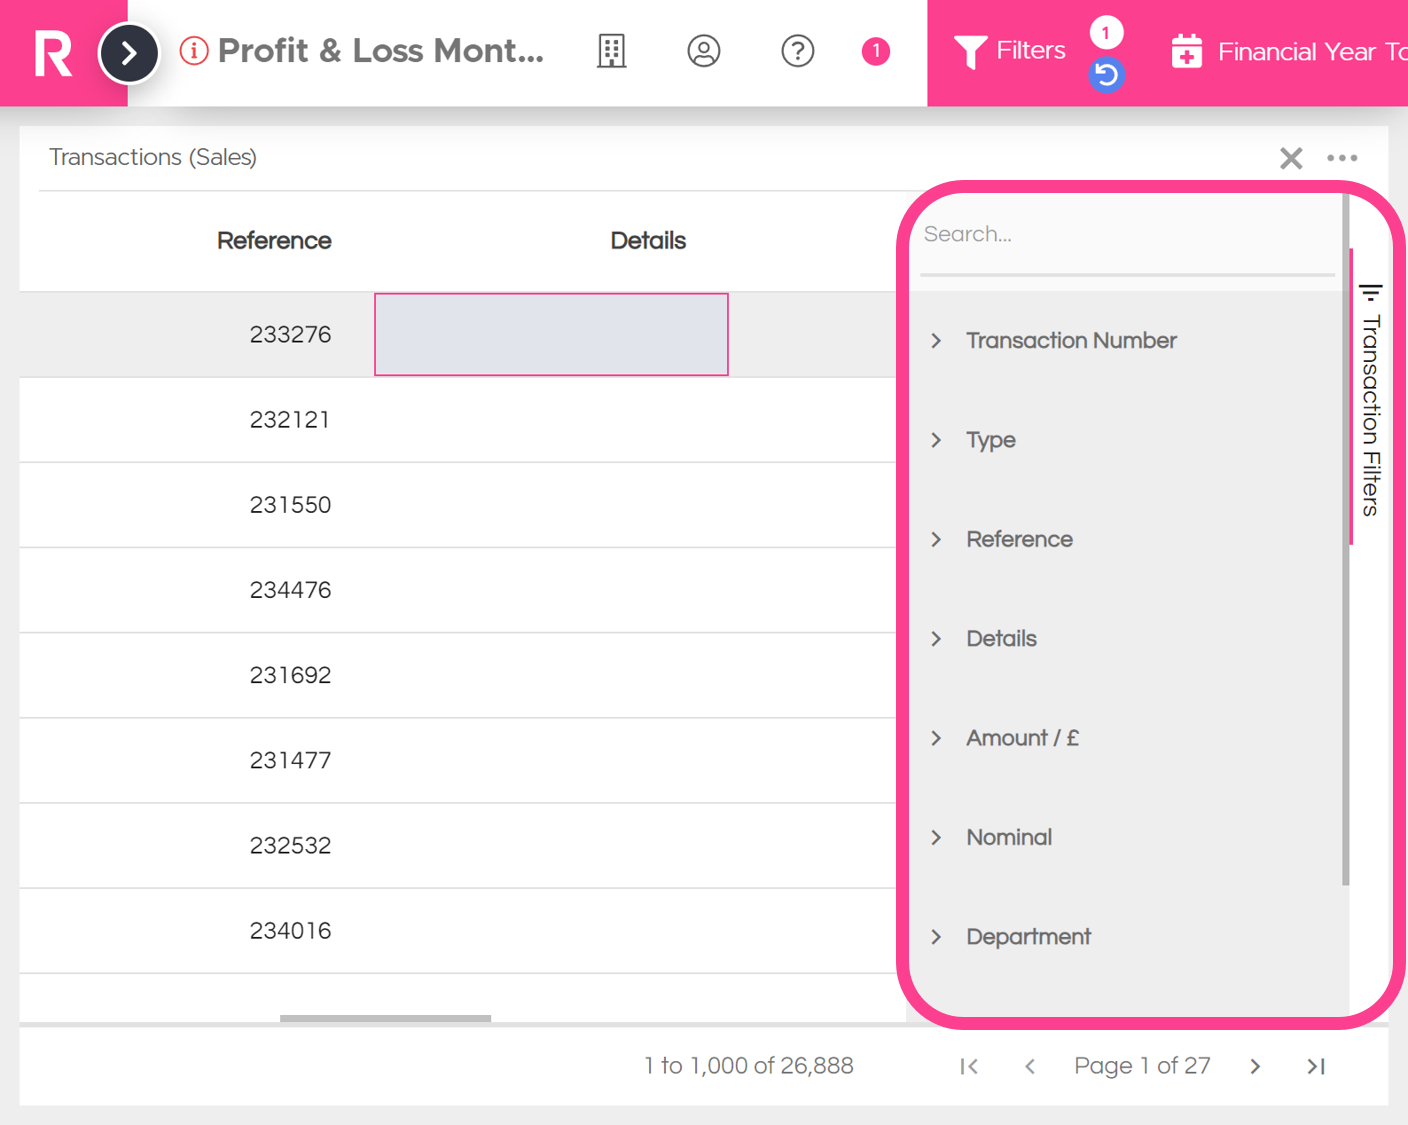
Table Filtering:
The filtering tool used on drill down tables has been improved. You can now refine your transactions list even further by Transactions, Types, References, Details, Amounts, Nominals, Departments, Paid Status and Customers/Supplier Names.
Colours
We have refreshed our brand colours inside the platform. Outlined below is a breakdown of what has transitioned from fuchsia to our vibrant pink across various elements of the platform:
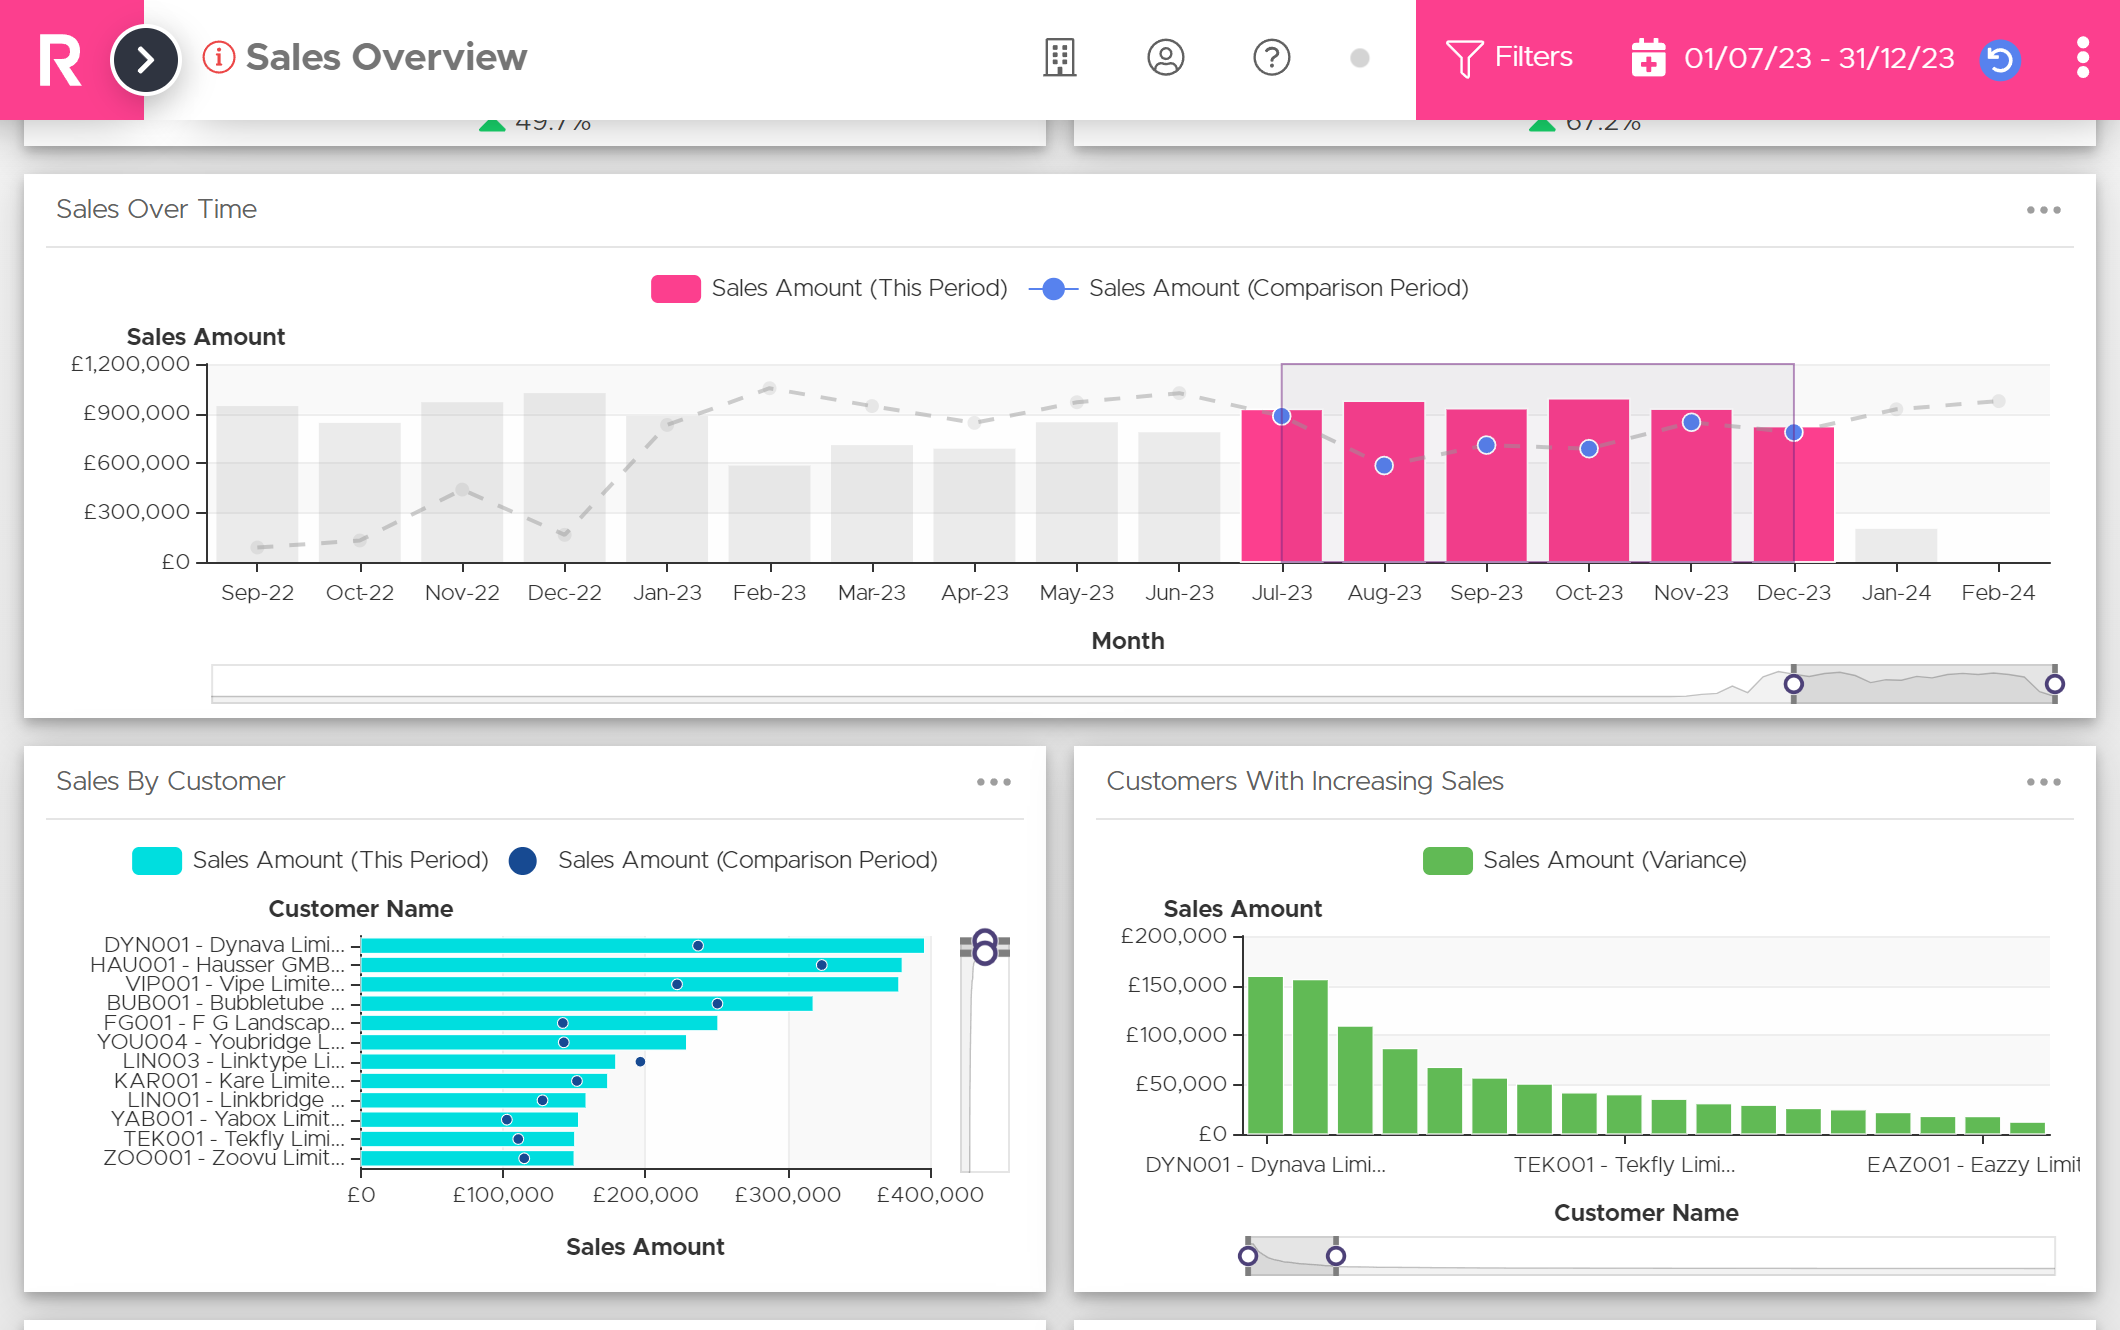
Chart Colours:
· The chart colours have been updated to enhance the contrast between the bars and comparison indicators.
Login Screen:
-
The Roveel logo on the login screen has been updated.
-
The background colour has been updated from white to grey.
Background:
The background colours on the logo, filter and date comparison bars and “What’s New?” section has been refreshed.
