Understanding your sales, products, margins, cash and profits is vital to your success as a retailer

Roveel allows you to dive deep into your Xero & Sage data with drill-down analysis at the transaction level, uncovering insights beyond surface-level numbers.
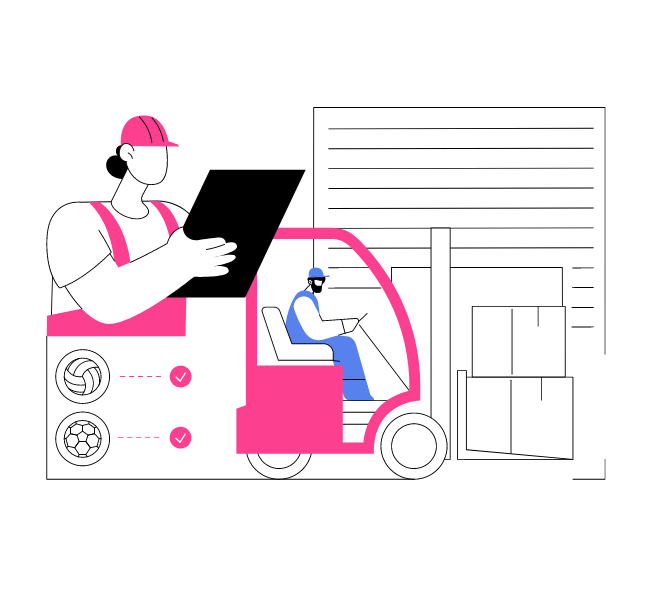
Track your project costs in providing detailed insights into labor, materials, and overhead expenses for each construction project.
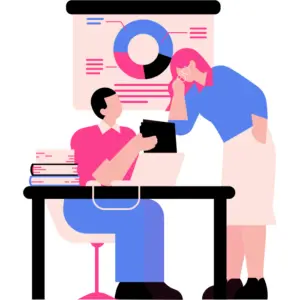
Monitor sales trends across various products and customer segments with Roveel's robust analytics tools.
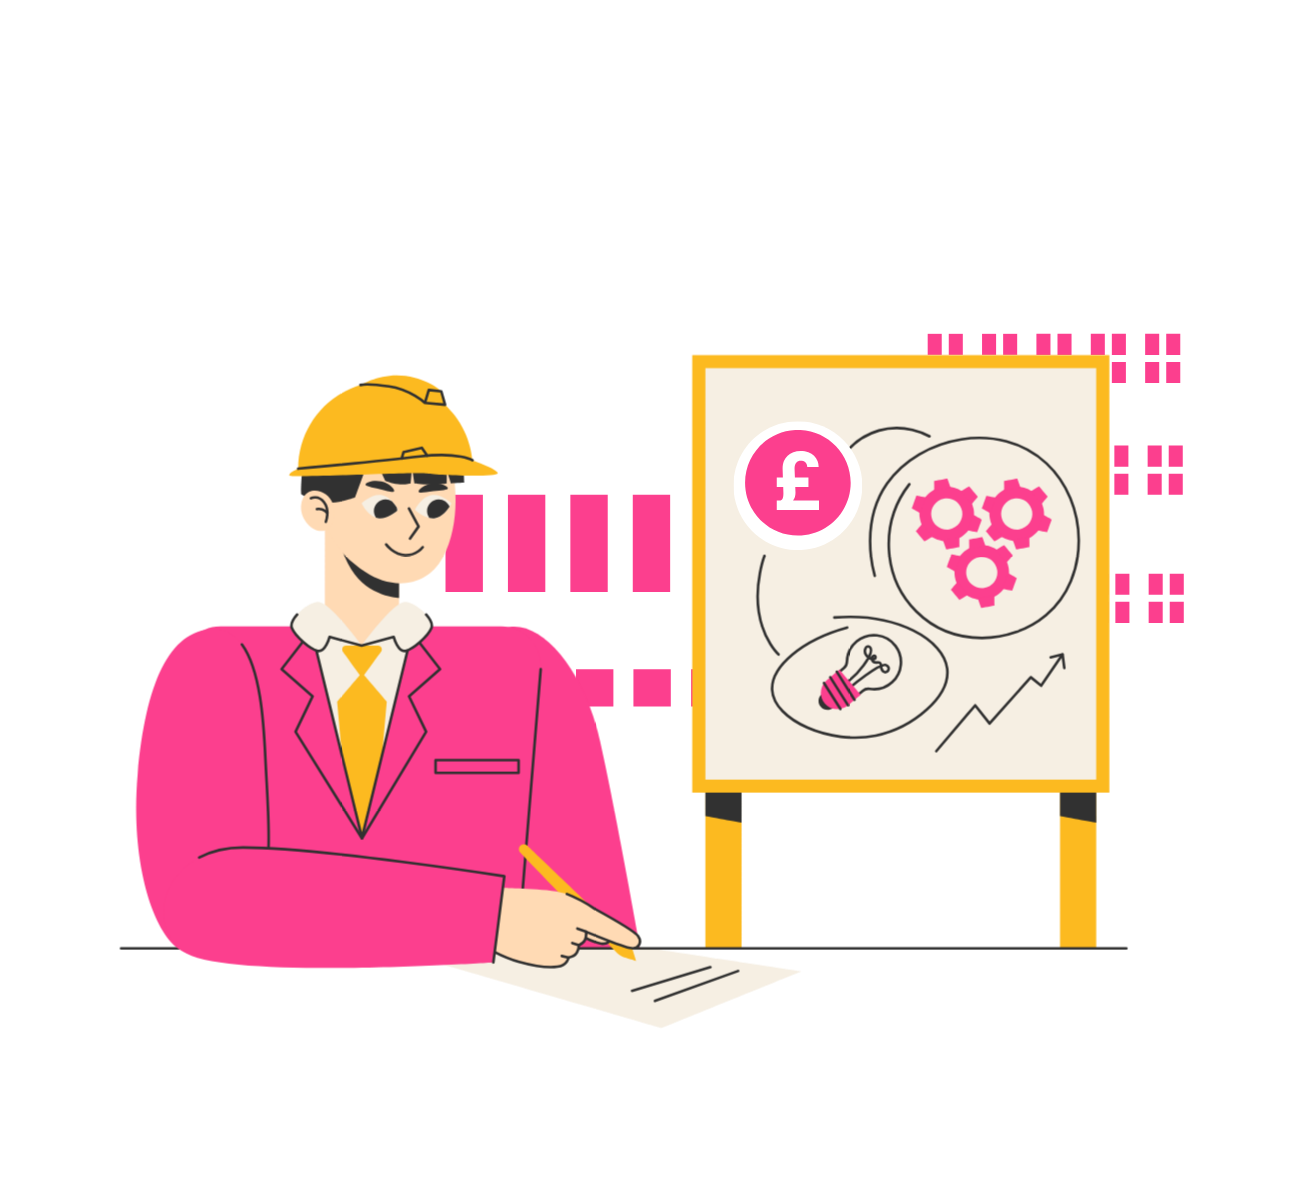
Analyse profitability at the project level with Roveel's robust job costing tools, allowing you to identify which types of projects or clients are most profitable for your business.
Leverage data-driven insights, you can optimise purchasing decisions, negotiate better terms, and strengthen relationships with your suppliers.
Analyse customer payment patterns, you can improve credit control and tailor your strategies to enhance customer relationships.
Address the unique challenges of your construction businesses, offering features that streamline inventory management, sales by product and more.
Tailor your dashboards to focus on the metrics that matter most to your business. Roveel creates personalised reports, making it easier to monitor performance and track key indicators relevant to your retail operations.
Access your data anytime, anywhere with Roveel's secure cloud-based dashboards & reports, enabling real-time insights from any device.
With its intuitive design, Roveel makes it easy for users at all levels to navigate the platform and utilise its features effectively, ensuring a smooth experience for your team.
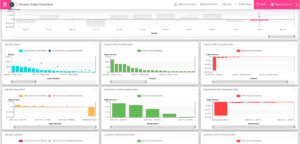
Get a high-level view of all your projects.
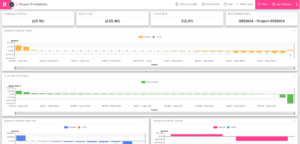
Analyse the financial performance of your projects.
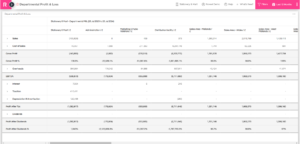
Analyse your P&L by department for Sage 50.
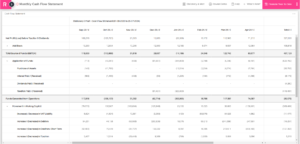
Monitor monthly cash inflows and outflows.
Discover the impact Roveel can have on your business. Get your free 14-day trial today.

Vibrant, insightful & drill-down cloud based dashboards for Sage and Xero. Improved decision making in an instant.


To provide the best experiences, we use technologies like cookies to store and/or access device information. Not consenting or withdrawing consent, may adversely affect certain features and functions.