PDF Reports Available:
Sales
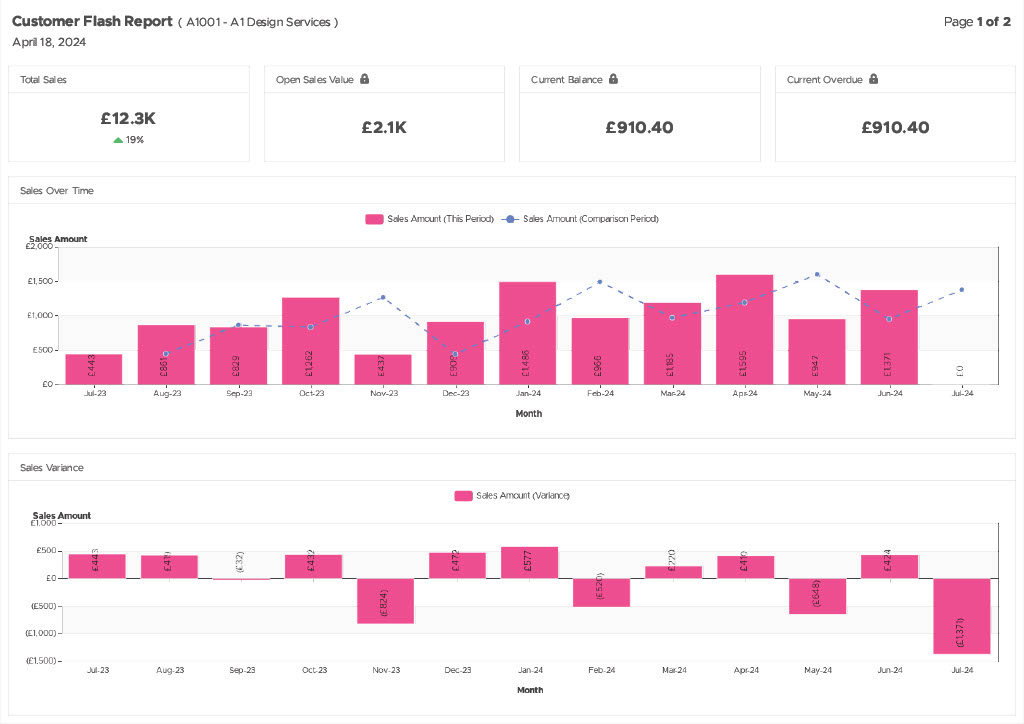
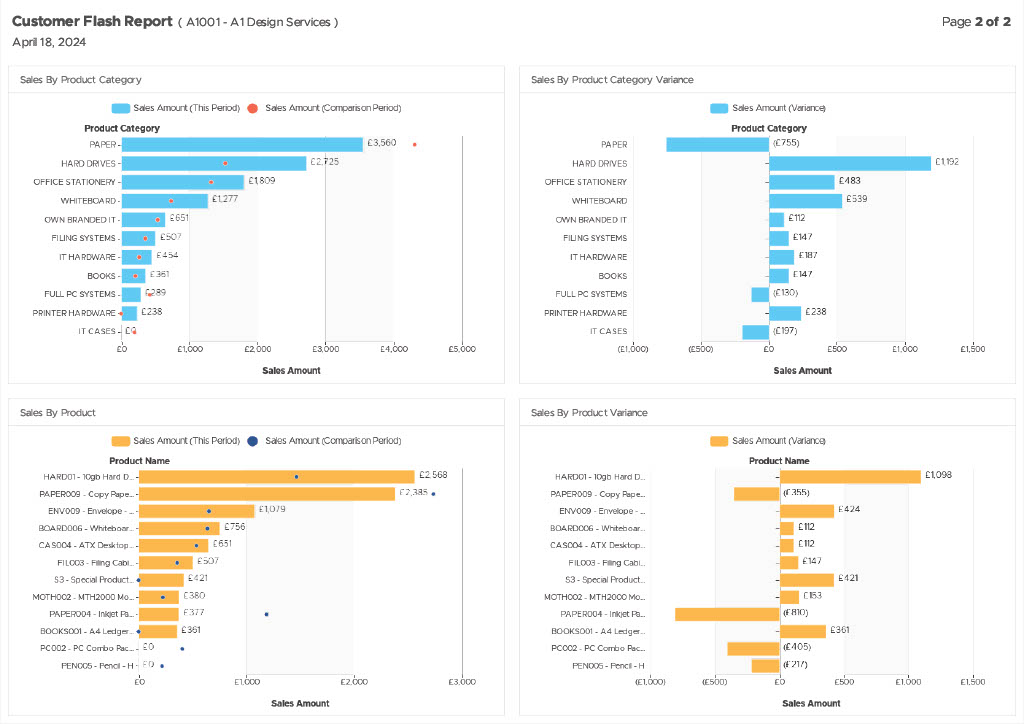
Boost your field and in-house sales teams' productivity with the Customer Flash Report. Instantly share customer sales performance insights to keep your team informed and motivated. Whether you're in the field or at the office, deliver key data with ease—hand out a printed report during meetings or send it directly to their inboxes. Stay ahead and empower your sales team with the insights they need to succeed.
Suppliers
For procurement, the Supplier Flash Report is a game-changer. Understand your spending patterns, identify areas for cost reduction, and negotiate better contracts. Equip your team with the knowledge to drive smarter decisions.
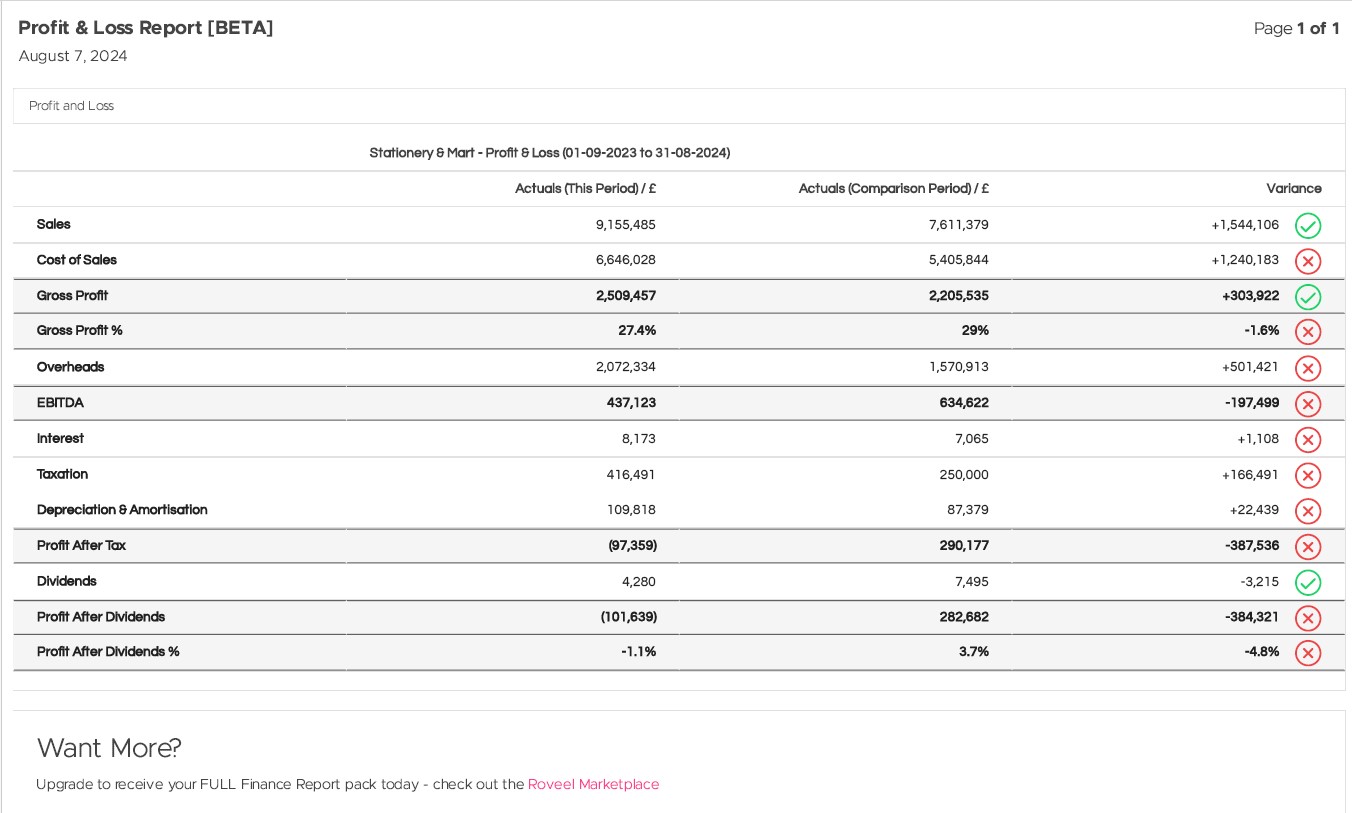
Finance
With the Finance Report PDF, effortlessly create your complete management accounts pack includes Profit and Loss, Balance Sheet, and Cash flow—with just one click. No more time-consuming Excel exports with manual field mappings. Your reports are instantly ready, customised with your logo (and we can bespoke them for you too!)
Why PDF Reporting?
Effortless Sharing
With just a click, you can download your reports as PDFs, making it easier than ever to print and email important information with your team or stakeholders. No more formatting hassles—just clean, professional reports ready for presentation.
Enhanced Accessibility
PDFs are universally accessible, ensuring reports can be emailed and viewed on any device. Whether in the office or on the go, your data is always within easy reach.
Professional Presentation
PDF reports maintain the integrity and visual appeal of your data, allowing you to showcase your findings with confidence. Impress customers, suppliers, clients and colleagues with polished, easy-to-read reports.
Sage 50 New Dashboards:
Discover the latest enhancements for Sage 50.
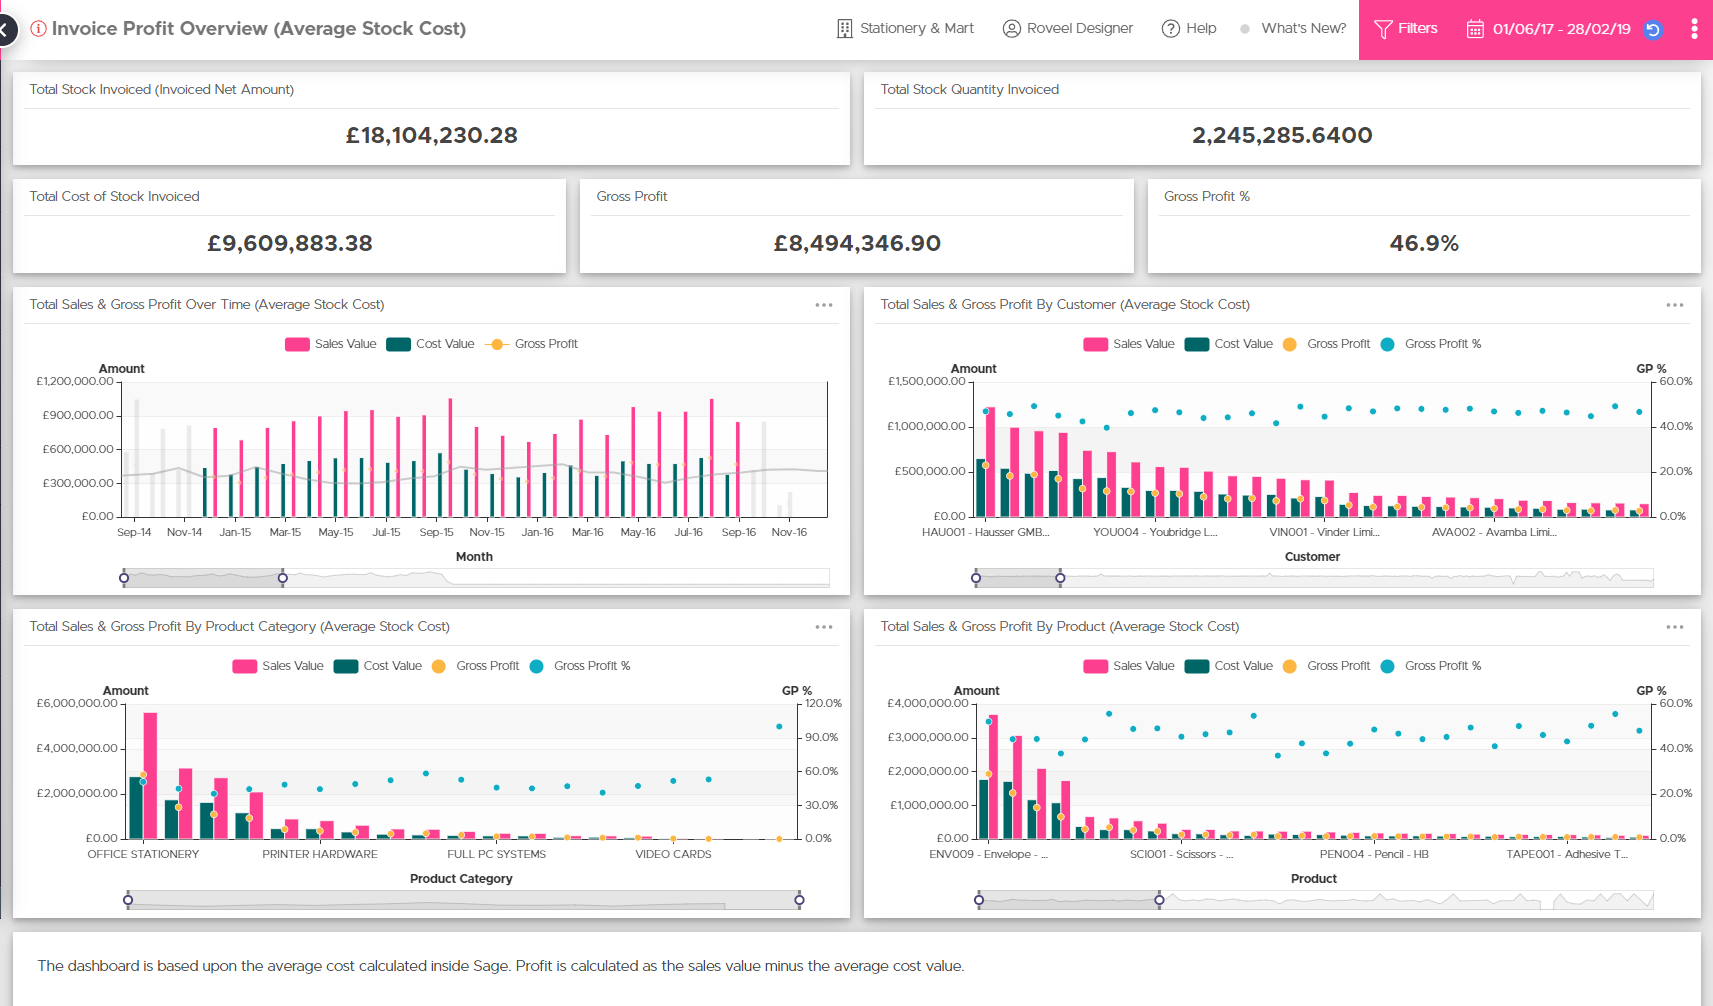
Invoice Profit (Average Stock Cost)
Analyse profitability using average stock cost. Get insights into product, customer, and category-level margins for financial tracking and benchmarking.
Invoice Profit (Last Stock Cost)
Evaluate profit margins based on last stock cost. Gain detailed visibility into product, customer, and category performance for informed decision-making.
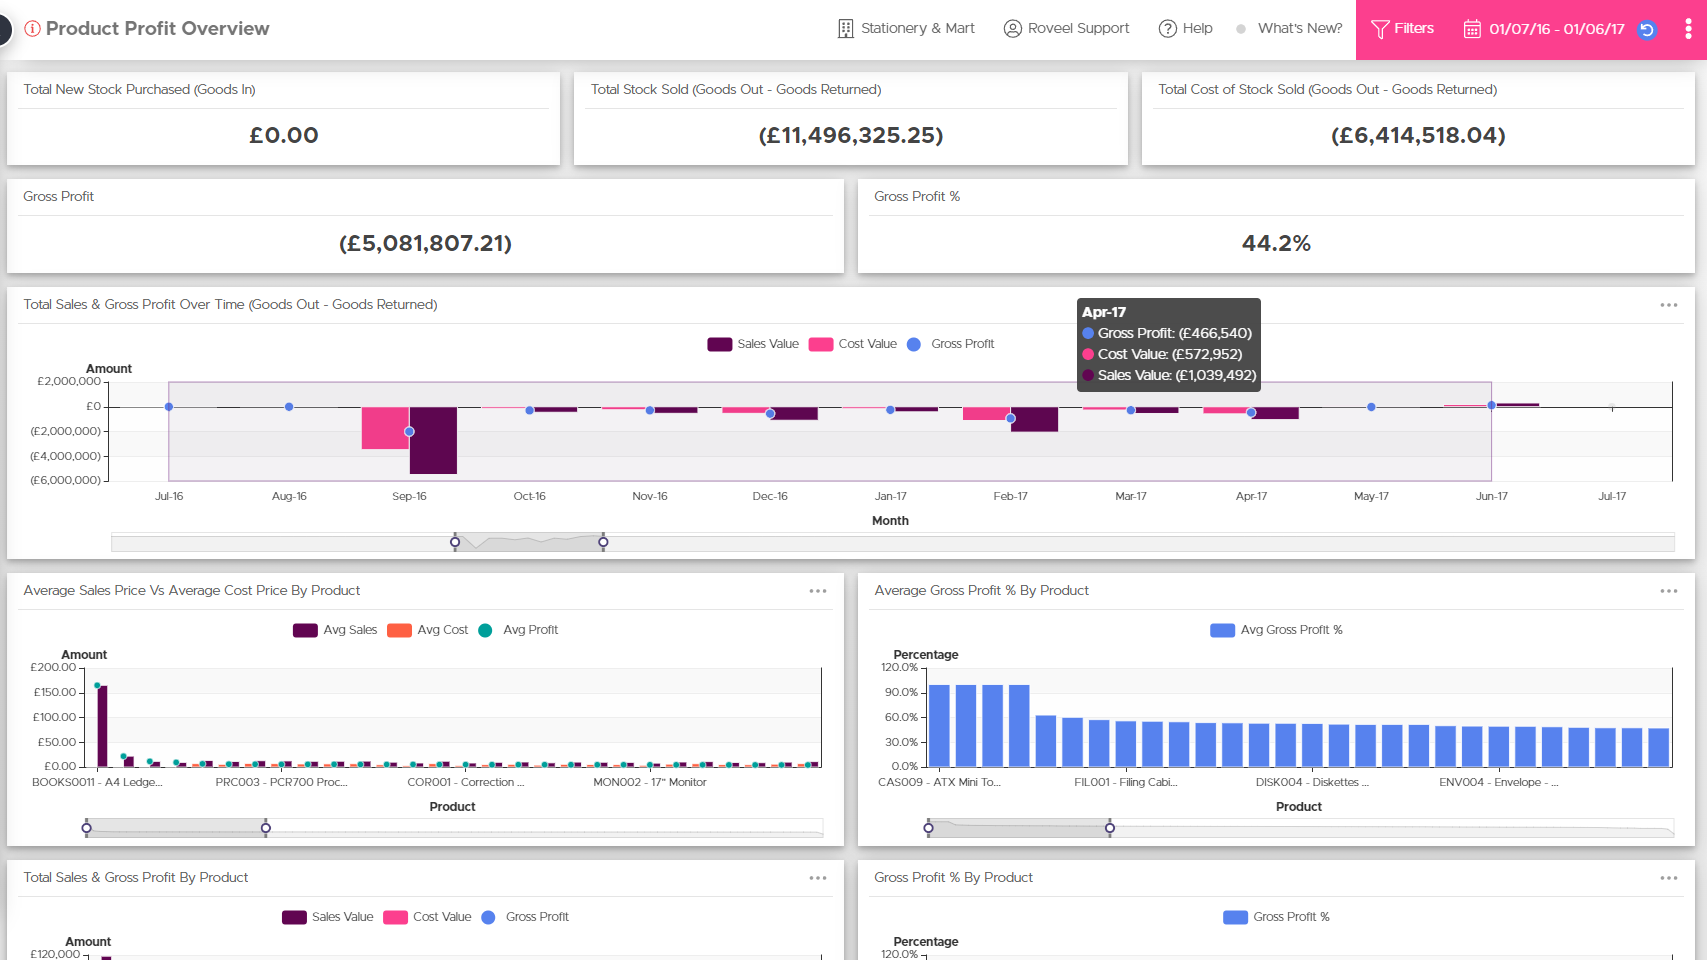
Product Profit
Analysing your profits ensures that you are maximising your opportunities to generate cash in your business. Identify your historic and current best and worst performing stock in a visual format. Understand gross profit by customer, product category and at product level.
Xero New Dashboards:
Explore the new enhancements for Xero.
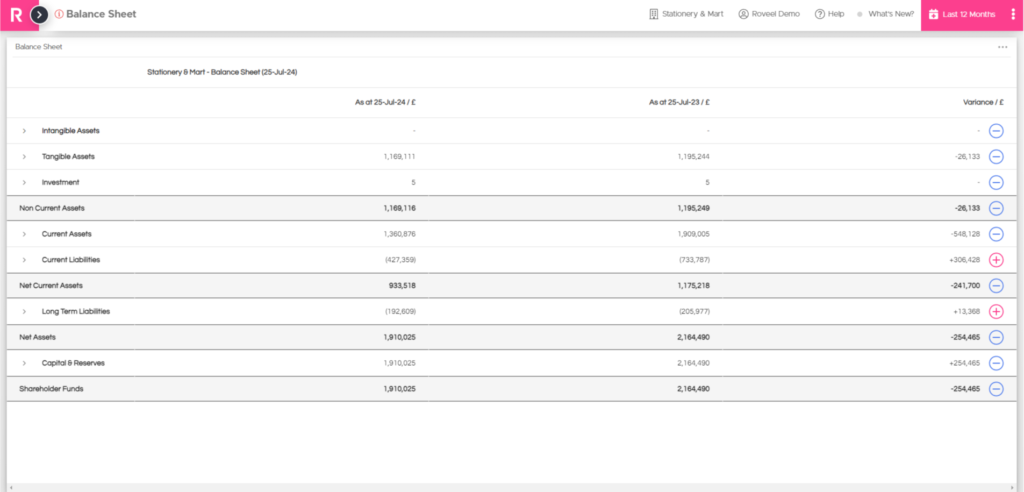
Balance Sheet
Compare financial position to assess liquidity, solvency, and overall financial health.
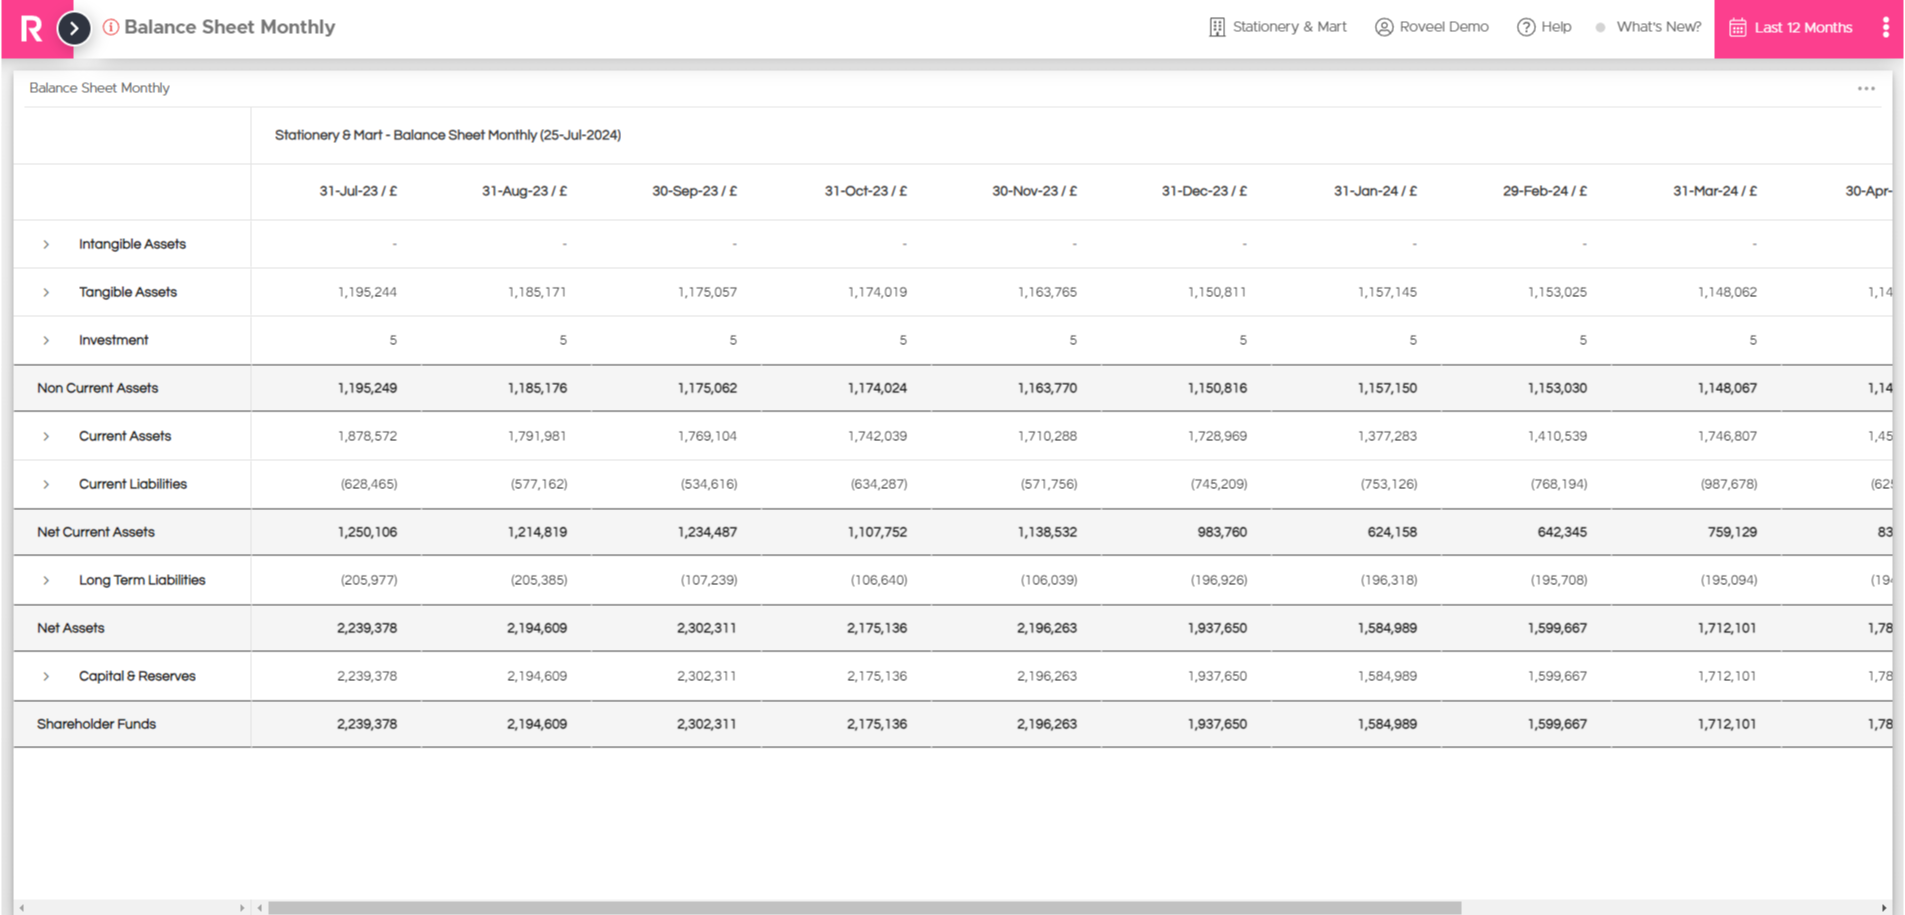
Balance Sheet Monthly
Monthly balance sheet with drill down functionality to analyse the underlying transactions.
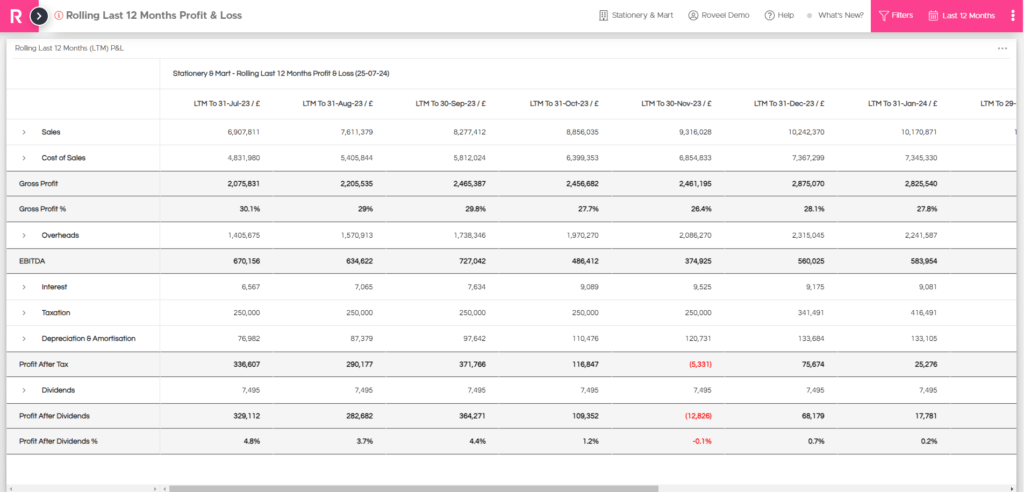
Rolling Last 12m P&L
Track financial trends highlighting growth areas and cost fluctuations for decision-making & performance optimisation.
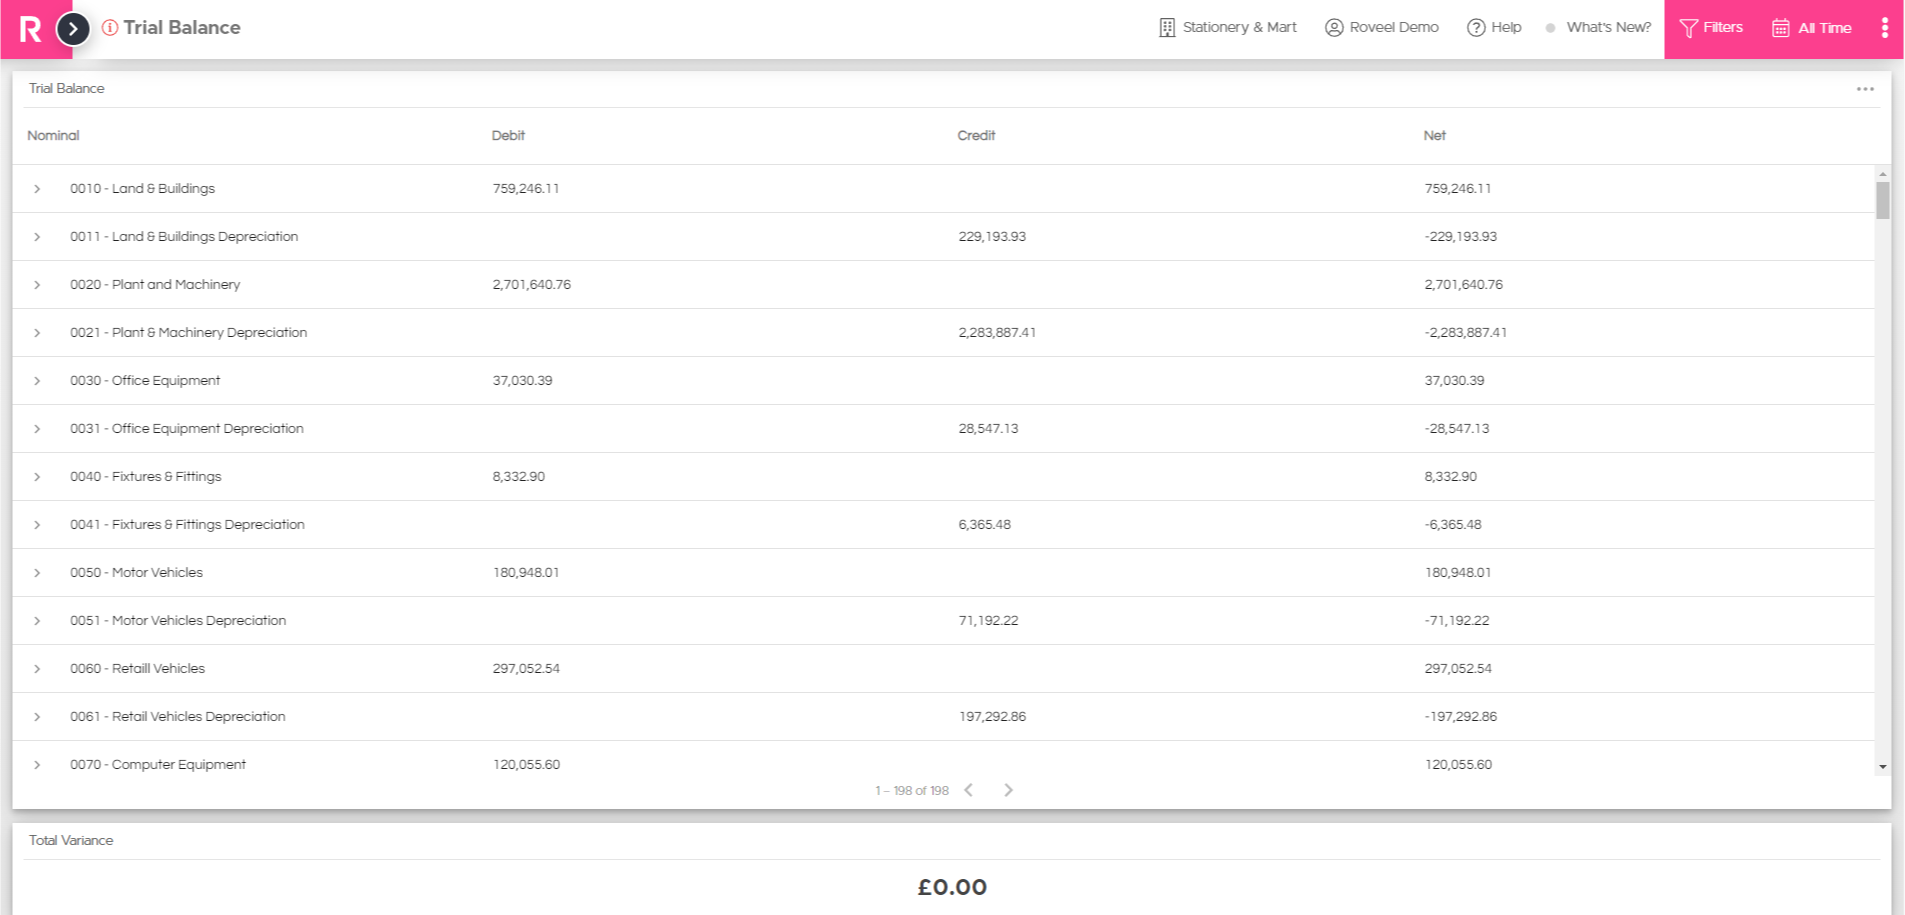
Trial Balance
View a comprehensive trial balance with the ability to drill down into individual transactions, ensuring detailed verification and reconciliation of account balances.
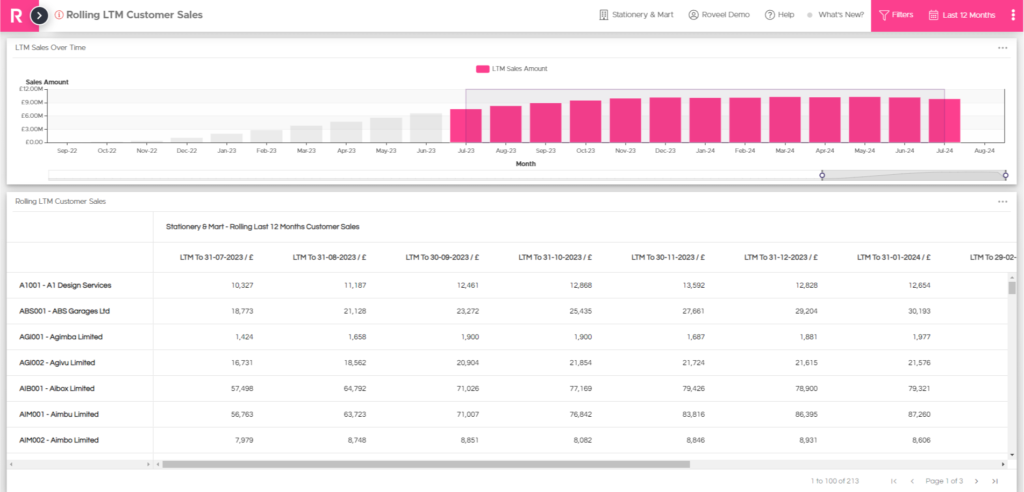
Rolling Last 12m Customer Sales
A dynamic view of customer sales performance over a rolling 12-month period, allowing you to analyse trends and patterns in customer spending.
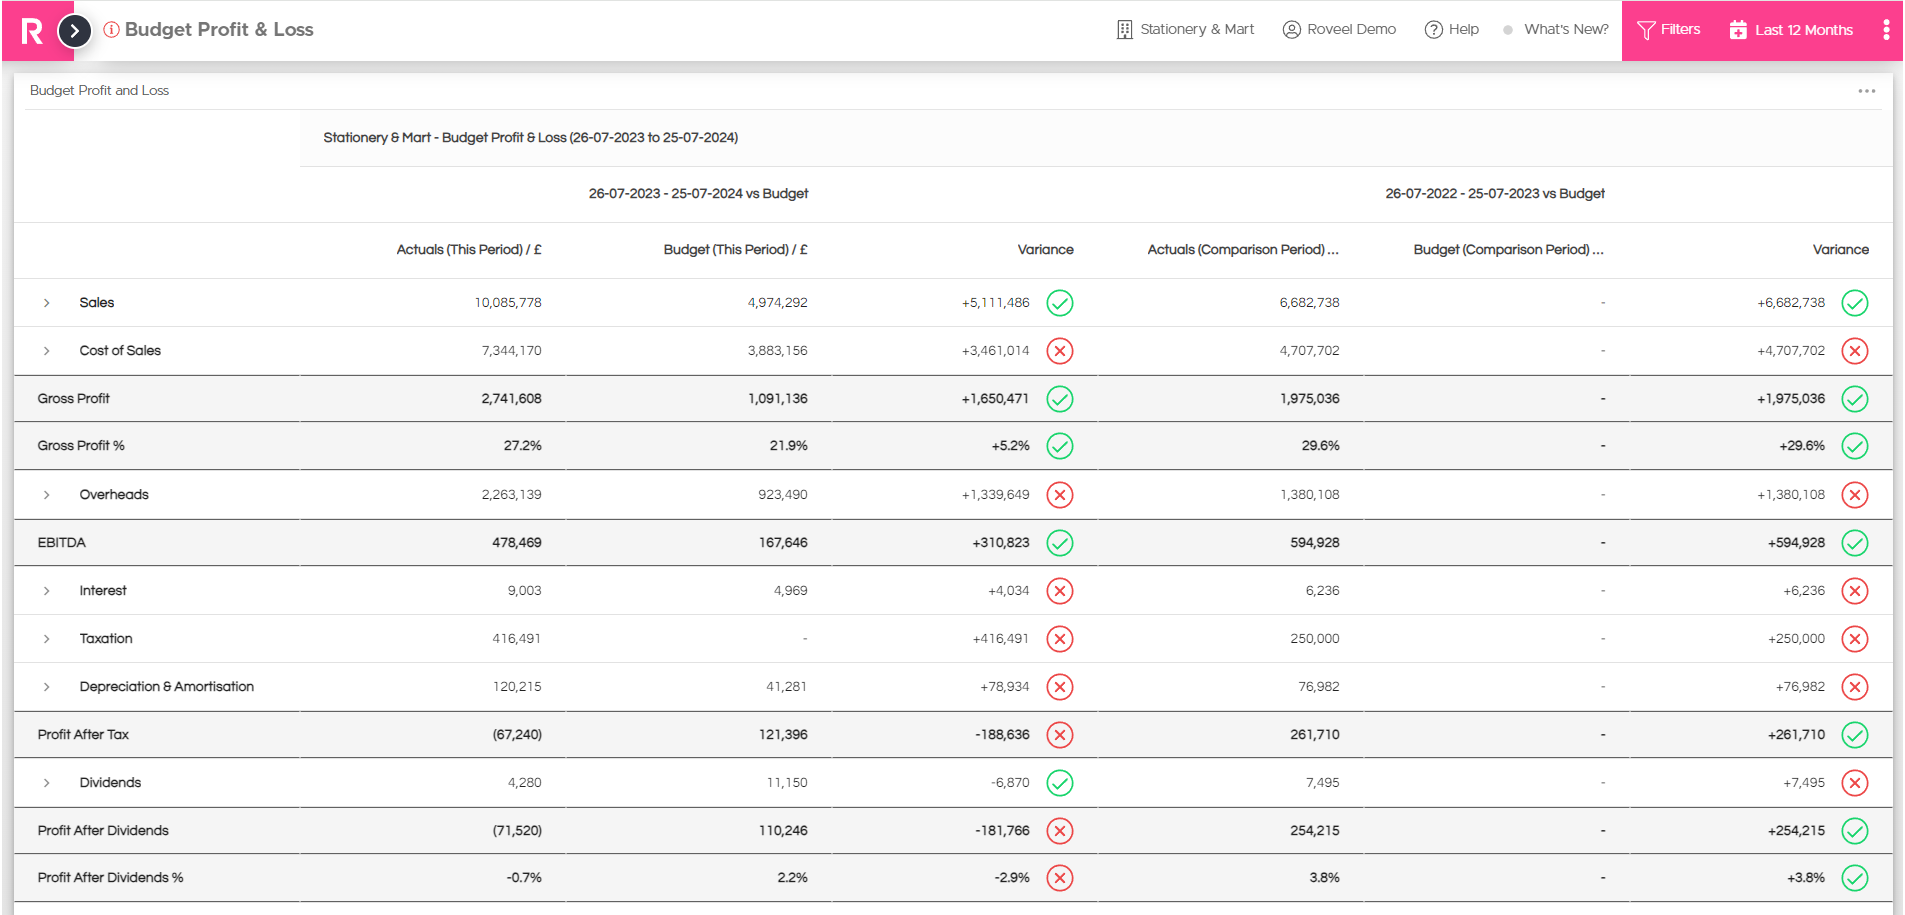
Compare actual financial performance against budgeted figures from within Xero, enabling precise tracking of variances and business performance.
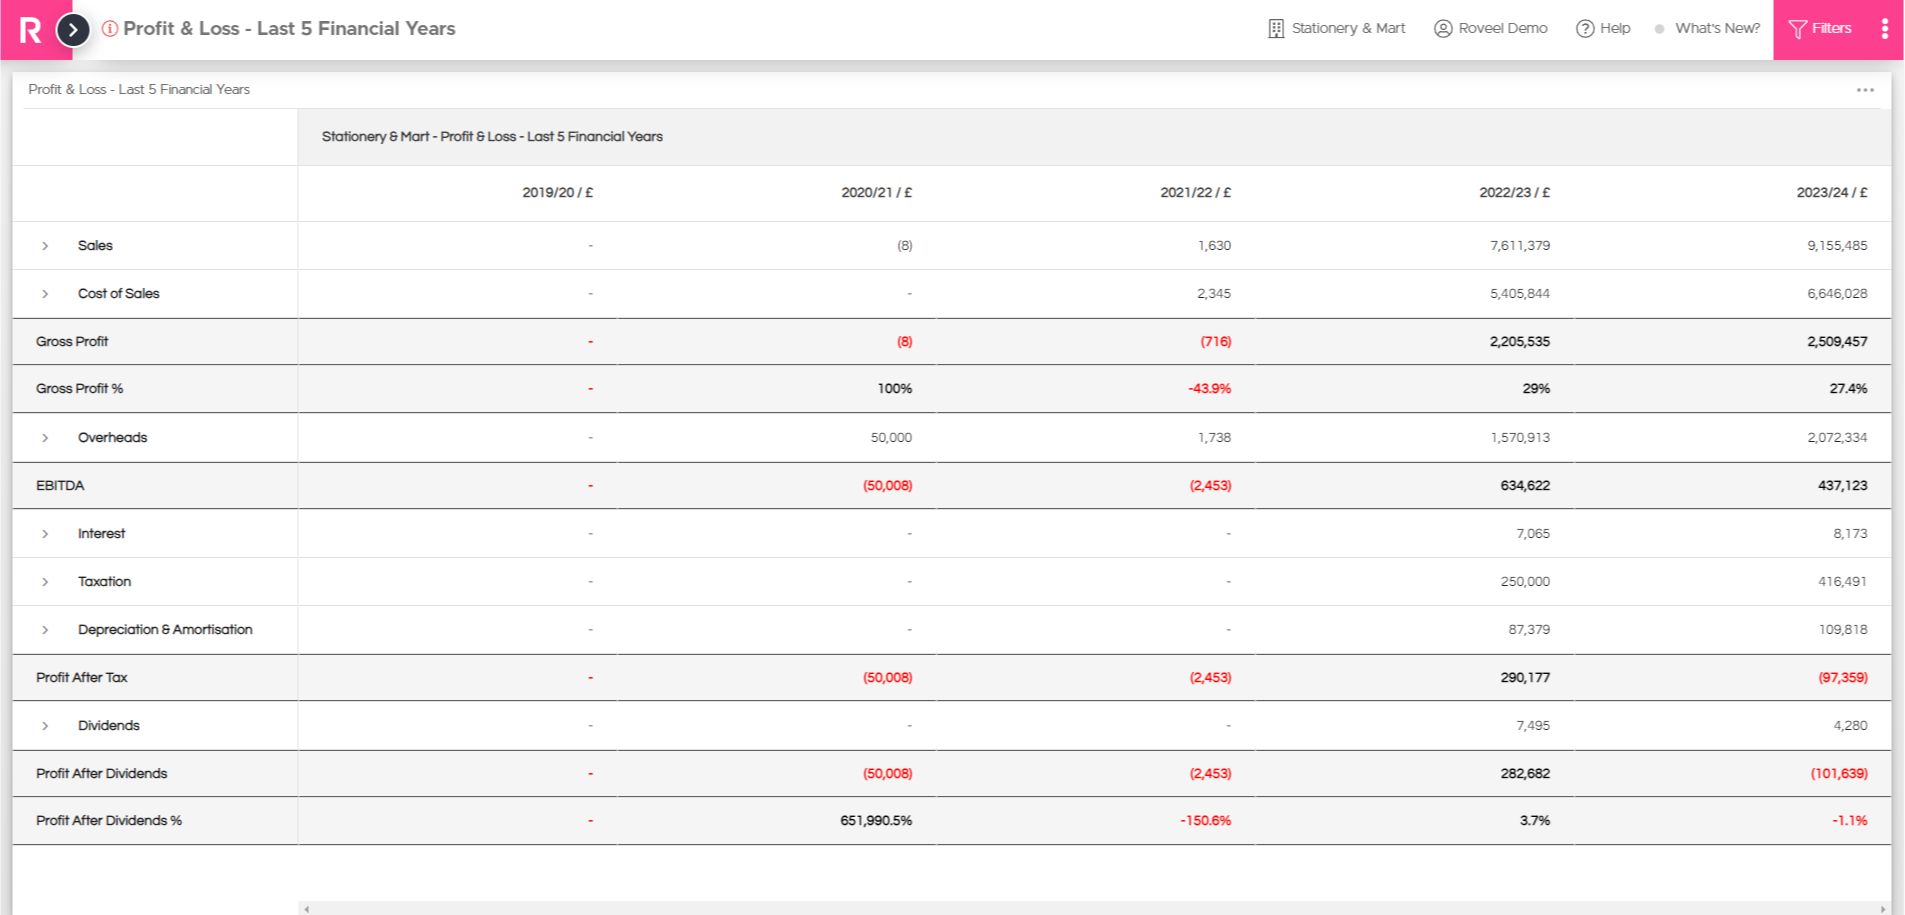
Analyse long-term financial trends by comparing profit and loss statements across five consecutive fiscal years.
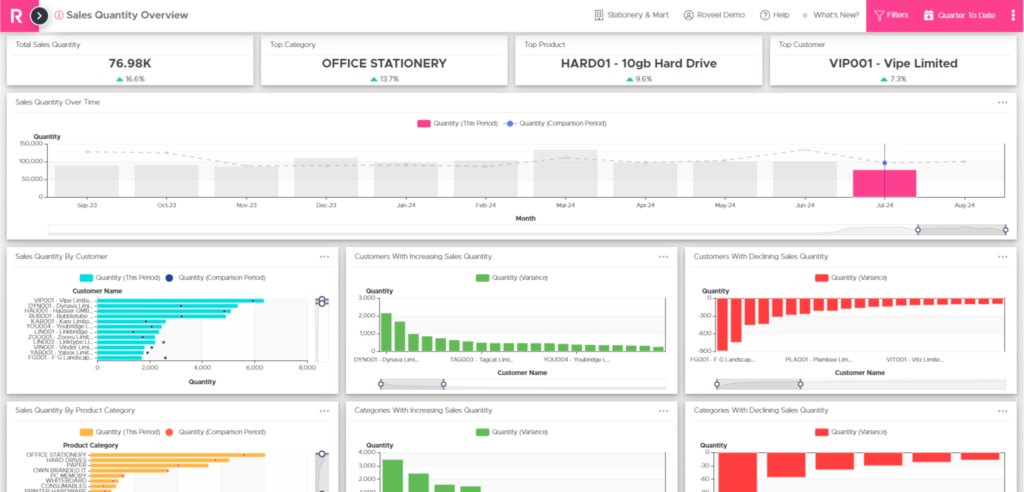
Visualises sales quantities across customers, products, and time periods, providing a comprehensive view of volume-based sales performance.