Make Your Choice for the Preferred Nation
Choosing the ideal destination for immigration is a pivotal decision that can shape the trajectory of your
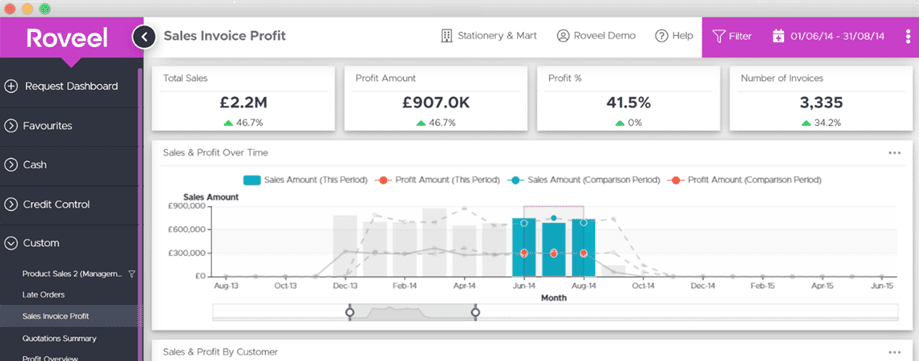

"Roveel is an excellent piece of software that enables us to instantly see where our business is at. We have saved a large amount of time as the analysis of data that we previously did on spreadsheets is already there on the dashboards. The credit control function is invaluable and the drill down function within it is much quicker than using the activity function on Sage itself."

"The Roveel team have been great to deal with during the implementation process. They are very professional and personable and have designed a bespoke P&L to suit the needs of our business and our reporting requirements. They have delivered on all deadlines and I think this product represents excellent value for money. I would highly recommend Roveel to anyone."
At the heart of our commitment to providing exceptional immigration solutions stands


Embark on a Global Exploration:
Experience
Joy in 190+ Countries
and Across the World