🔔 

Experience Roveel in action: 
Try our Interactive Demo Now! 

🔔 

roveel logo pink

Visual Budget Profit & Loss

Integrates with: ,

Visualise budget vs. actual P&L performance.

Price: £7.50
Category Integrations ,
Product Category:

Price:  

£7.50

/month

Product Description

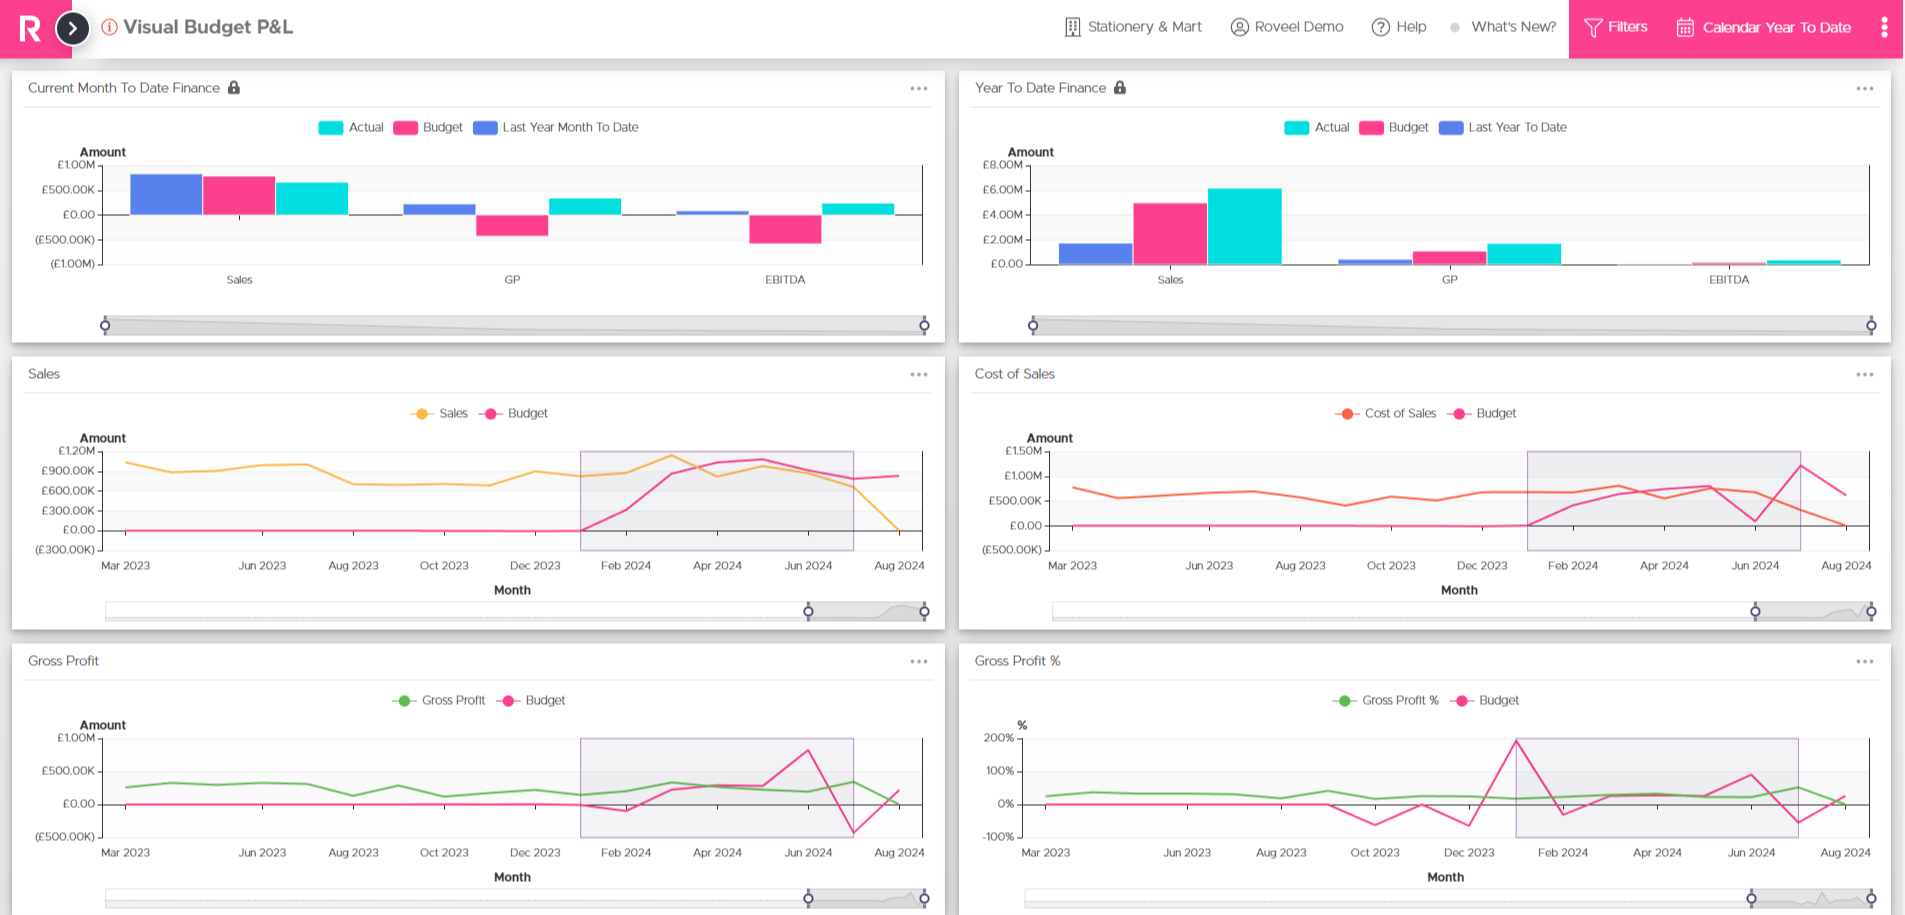
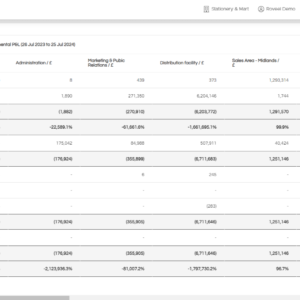
Get a graphical representation of how your actual Profit & Loss performance compares to your budget. Spot variances and trends at a glance.

Key Benefits:

Visualise Budget vs Actual Performance
Compare your actual Profit & Loss results against budget through clear, easy-to-understand charts and dashboards.

Identify Variances Instantly
Spot differences between budgeted and actual figures at a glance, helping you investigate issues before they impact your business.

Advanced Date Comparison
Analyse financial performance across different time periods using flexible date comparisons. Choose from a range of preset periods or select custom dates to compare exactly the data you need.

Departmental Filtering
Filter your Profit & Loss by one or multiple departments to gain deeper insight into the performance of individual areas of your business.

Drill Down to Transaction Level
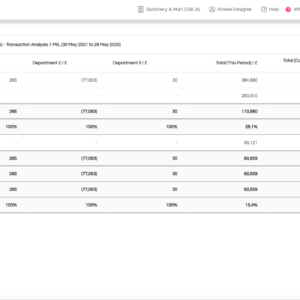
Investigate variances in greater detail by drilling directly into the underlying transactions. Quickly identify anomalies and unusual activity with a simple right-click using the Show Transactions feature.

Seamless Sage & Xero Integration
Connect directly with Sage 50 or Xero to synchronise your budget and financial data automatically.

Ideal for:

  • Finance directors monitoring budget performance and financial variances
  • Management accountants producing detailed budget and management reports
  • Department managers reviewing the financial performance of their teams
  • Business owners looking to keep spending and profitability aligned with budget


With Roveel’s Visual Budget Profit & Loss, you gain instant visibility into how your actual financial performance compares with your budget. Consequently, you can identify variances early, monitor financial trends and make proactive business decisions.

Instead of manually comparing reports or analysing spreadsheets, you can now view budget and actual performance through one centralised, interactive dashboard. Furthermore, advanced date comparison and departmental filtering enable you to analyse your financial data from multiple perspectives. In addition, the ability to drill down to individual transactions helps you investigate discrepancies quickly and improve the accuracy of your financial reporting.

Take control of your budget monitoring today with Visual Budget Profit & Loss. Gain the valuable insights needed to track performance against budget, investigate variances and ultimately make more informed financial decisions.

Related Products